Childcare Subsidies Can Be an Effective Anti-Poverty Tool

Over the past few years, child care and early education have emerged as key public policy problems. This trend has come about in a time of increased participation in the workforce by mothers and rising costs for childcare.

With the growth of childcare as a public policy problem, child care subsidies have become a larger part of US antipoverty policy. In particular, child care subsidies help families fight poverty in two ways: by providing parents with resources and by giving children a boost that leads to wage growth down the road.

Child care subsidies reduce current poverty

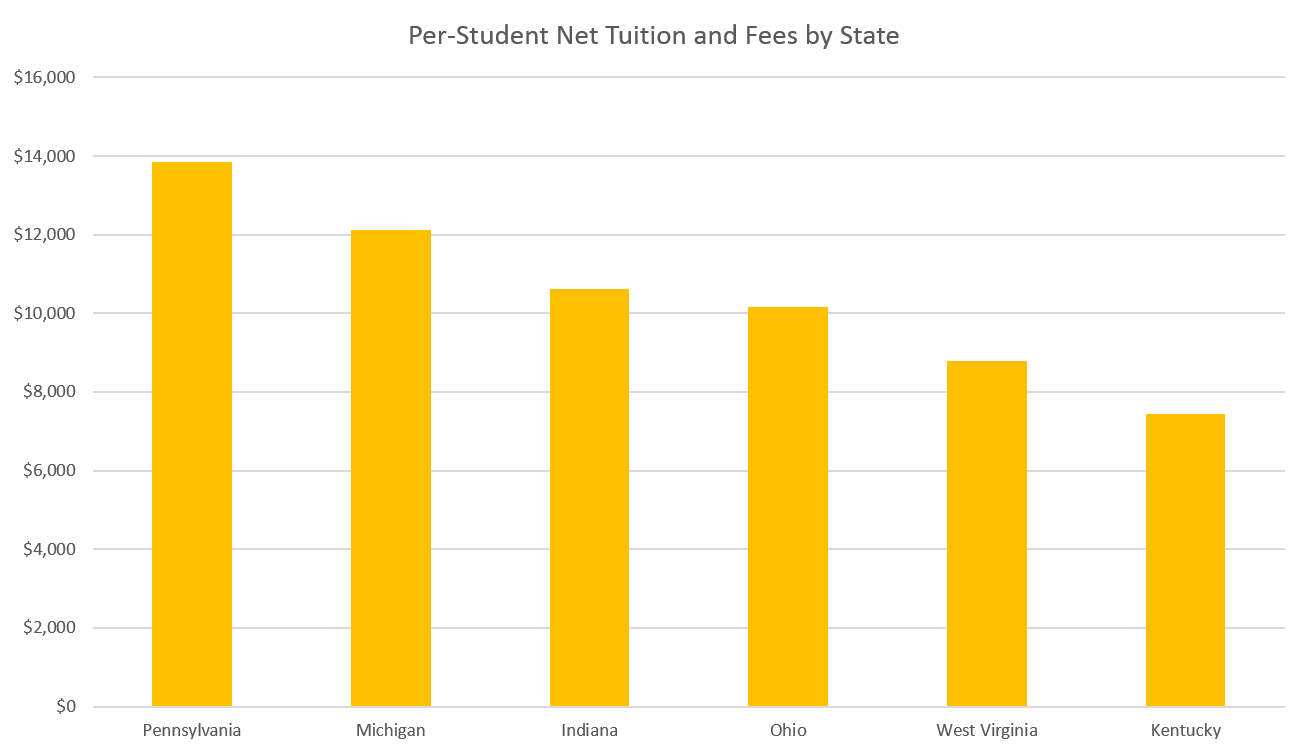
A child care or preschool slot provided for free to a family has the effective value of $9,500 in Ohio. This makes the total benefit for a family with two children ($19,000) higher than the average social security benefit ($17,000 annualized), the average unemployment benefit ($16,000 annualized), the average disability benefit ($9,000), the average Medicare benefit ($8,000), the average Affordable Care Act tax credit benefit ($6,000), the average Medicaid benefit ($6,000), the average Pell Grant ($4,000), the average earned income tax credit ($3,000), and the average SNAP (formerly “food stamps”) benefit ($3,000 annualized).

Data sources linked above

Data sources linked above

While one child in public childcare eclipses seven of nine major safety net items above for the average recipient, two children in public childcare makes public childcare the most generous major safety net measure in the United States, worth 91% of the value of the federal poverty level for a family of three, even though public benefits such as child care benefits are not counted in measuring income towards the official poverty measure. Child care subsidies are an important tool for reducing poverty among poor families directly.

Child care subsidies alleviate intergenerational poverty

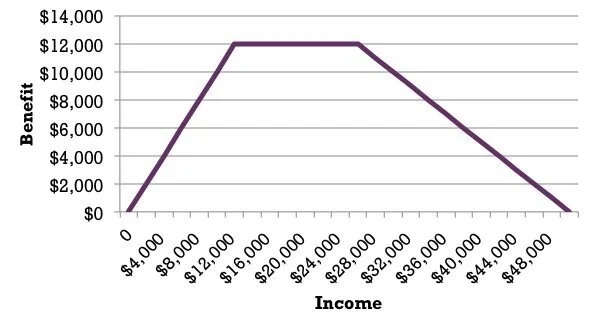
In addition to supporting families today, child care subsidies can be a tool for fighting intergenerational poverty. High-quality early childhood education has been shown in experimental settings to have wage benefits down the road for low-income children in particular in addition to crime and health benefits. In Timothy Bartik’s book Investing in Kids, the labor economist models a universal pre-k program with income-based fees, coming to the conclusion that the long-term wage boost to low-income children would be 11,000 times as large as the wage boost to high-income children as a function of previous expected wages.

If child care subsidies are progressive and ensure proper quality, they can be an effective tool for breaking intergenerational poverty.

Poorly deployed childcare subsidies can hurt families and children

While these results seem to paint a rosy picture for child care as a tool for equity, results from Canada should give us some pause. In the late 1990s, Montreal instituted a universal child care program without any quality controls. An analysis comparing Montreal to other provinces after the reform found children to have higher anxiety and aggression and worse development scores and health outcomes after the reform, while parents exhibited more hostile, inconsistent parenting behaviors along with less parental satisfaction and even higher levels of maternal depression. One of the possible explanation for these results is that children were getting less time to interact and build strong relationships with parents at young ages.

The balance of the evidence suggests that childcare subsidies smartly deployed can be a strong tool for reducing family and intergenerational poverty. That being said, subsidies should be deployed with caution in order to ensure that they are targeted towards high-quality programs and that they do more to encourage rather than discourage positive family interactions.

No, Columbus is not a startup city

Columbus’s startup community gets a lot of love, and we at Scioto Analysis like to celebrate it as well,as a startup ourselves. With that in mind, I was surprised when a colleague at lunch yesterday told me Columbus has one of the weakest startup industries in the country.

Of course, I went straight for the data. The Ewing Marion Kauffman Foundation publishes a comprehensive annual report on startup activity by metro area. Using IRS data collected by the Bureau of Labor Statistics, Kauffman compiles the “startup density” of the top 40 metro areas in the country, defined as the number of firms less than a year old that employ at least one person besides the owner per 1,000 total businesses.

Columbus’s startup density is in the bottom quintile nationally, only outpacing five other metro areas: Cincinnati, Providence, Milwaukee, Pittsburgh, and Cleveland. While the average large metro area has 83 startups per 1,000 businesses, Columbus punched in at 66 startups per 1,000 businesses in 2017, 20% lower than that average. Columbus looks a little better when you compare it to other regional metro areas, but still only falls in the middle of the list of seven metro areas in Ohio and neighboring states.

Picture1.png

But doesn’t Columbus have a strong job market? And don’t small businesses drive job growth? Not so fast. By compiling jobs data from the Bureau of Labor Statistics, we can see that Columbus’s employment growth was basically flat from 2017-2018, placing it in the bottom quintile of large metro areas in job growth ahead of only San Diego, New York, Sacramento, Chicago, and Pittsburgh. Columbus even looks weak regionally, especially compared to high-growth Indianapolis and even against other Ohio cities Cincinnati and Cleveland.

Finally, let’s look at the relationship between the two variables. Using a standard correlational analysis, we can see that there is a weak relationship between startup density and job growth. Among our regional metro areas, six are clumped in the bottom left quadrant, showing low levels of both startup density and job growth compared to other large metros nationally. While Cleveland, Cincinnati, and Philadelphia follow the national trend fairly well, Pittsburgh, Columbus, and Detroit each have more sluggish job growth than their startup density would predict. Also note Indianapolis, which has 12% more startups per 1,000 businesses than the average regional city, but four times the job growth as the average regional city, making it the regional outlier.

scatterplot.png

Despite all these troubles, Columbus continues to grow in population and economic activity. It may have been that 2018 was a particularly bad year for Ohio, so these trends could reverse in 2019. That being said, it is hard to truly make the case that Columbus is a startup Mecca. Columbus is merely average regionally and quite weak nationally when it comes to startup prevalence.

The Top 5 Studies of Scioto Analysis's First Year

Today, Scioto Analysis celebrates its first birthday. Over the past year, Scioto Analysis has served clients in five different states and has analyzed issues ranging from tax to health and human services to environmental and education policy. Below are Scioto Analysis’s top five studies of its first year.

  1. Waiting for Services: Nebraska’s Developmental Disabilities Waiting List
    In October, Scioto Analysis partnered with Disability Rights Nebraska and the Nebraska Consortium for Citizens with Disabilities to study the waiting list for developmental disability services in the state of Nebraska. While all Nebraskans with developmental disabilities are entitled to services to help with every day living, gaining capacity, and employment, the average Nebraskan with disabilities waits seven years to get these services. In this study, Scioto Analysis found that this was due to a $33 million shortfall in state spending from 2008 to 2016 that caused the state waiting list for services to slowly grow over that time period.

  2. Earned Income Tax Credit Refundability: A Cost-Benefit Analysis
    As a social enterprise, Scioto Analysis is committed to improving the quality of public policy analysis at the state and local level, which includes demonstration projects of key analytical techniques. This August study was the first best-practices cost-benefit analysis of a state policy in Ohio in over a decade. Scioto Analysis found that proposals to expand Ohio’s state earned income tax credit would raise the average worker’s wages by hundreds of dollars along with growing the economy, increasing employment, increasing college enrollment, and reducing instances of low birthweight.

  3. Ohio’s Economy: 2009-2016
    While gross domestic product is the most common indicator used to measure economic growth in the United States, it leaves out key economic considerations such as the cost of inequality and environmental damage and the value of housework and higher education. The genuine progress indicator (GPI) is an alternative indicator that measures economic growth through 26 different economic, environmental, and social indicators. When Scioto Analysis launched in November last year, it partnered with Gross National Happiness USA to measure Ohio’s GPI since the Great Recession. Scioto Analysis found that rising inequality had taken a significant bite out of Ohio’s economy since the end of the great recession, costing the average person about $900 a year.

  4. Cost-Benefit Analysis in Ohio: Building State Policymaking Infrastructure
    In order to carry out its double bottom line mission, Scioto Analysis carried out a study in April assessing Ohio’s use of cost-benefit analysis in state policymaking. Scioto Analysis identified 27 studies from 2012 to 2018 that at a very minimum assessed direct costs and measured outcomes, though did not find any studies that followed the eight best practices of cost-benefit analysis.

  5. Beyond the Gas Tax: How Automation Opens the Door for Vehicle Miles Traveled Fees
    In March, Scioto Analysis released a white paper on vehicle miles traveled fees for autonomous vehicles. By taking advantage of the efficiency gains of automation and the availability of data due to computerization, state and local governments will have new opportunities very soon to implement the “holy grail” of capturing the costs of driving.

It’s been a great first year for Scioto Analysis and more high-impact analysis is in the works. Stay tuned to see what great stuff we have in store for the upcoming year!

Let's Talk about Benefits Cliffs

If you’ve been to a public meeting about poverty, you’ve probably seen someone stand up and smugly let you know about a little thing called a “benefits cliff.”

If you haven’t heard of a benefits cliff, here’s a simple explanation: a well-designed social welfare program has a “phase out” schedule. The idea is that if you make more money, you slowly lose your benefit. Take the earned income tax credit. The earned income tax credit slowly phases out for people making more income so that beneficiaries of the credit don’t lose all their money at once. 

Figure 1. EITC Model

Figure 1. EITC Model

Compare this to a program like SNAP (formerly “food stamps”), which has a strict income cutoff, after which you are no longer eligible for the program. So in Ohio, if a single worker makes $16,000 in a year, she is usually eligible for about $2,400 in food assistance, making her effective income $18,400. But if she crosses that wage threshold and make $16,500, she loses her benefit, meaning her effective income drops by almost $2,000—just for getting a raise! 

Figure 2. SNAP Model

Figure 2. SNAP Model

Emily Campbell of the Center for Community Solutions is Ohio’s resident expert on benefit cliffs. She had modeled benefits cliffs for different family sizes and has presented extensively on the topic. As you can see from the graphic below, benefit reductions should theoretically slow income growth at many points in the income distribution.

Figure 3. Center for Community Solutions Benefits Cliff Model

Figure 3. Center for Community Solutions Benefits Cliff Model

 In particular, according to this model, we should see a lot of single-parent two-child families “clumping” at about $17/hr annualized, which equals about $35,000. This is because, according to this model, making anywhere from $35,000 to $56,000 annually results in the same net income, so less work is better in this situation.

When I studied this problem as my capstone in graduate school, I found some evidence of clumping in publicly-available income data, but the effects were small. While there is a lot of theory and anecdotal evidence of the impact of benefits cliffs on work output and human capital development, there is little empirical evidence to demonstrate these impacts are actually happening.

Reasons to be skeptical about arguments about the impact of the benefits cliff include behavioral explanations. Human beings are pretty lousy at interpreting the tax and benefit system. It’s hard to make the argument on one hand that low-income people need financial literacy training and on the other hand that they are deciphering a complex benefits system to maximize their return for a given work input.

That being said, it is hard to argue the benefits cliffs have no impact at all. In my capstone work, I did detect some evidence for limited “clumping” at certain incomes which could have been driven by benefits cliffs incentives. So what do we do about these design problems?

The first step is to acknowledge them for what they are: design problems. It is pretty easy to redesign programs to phase out benefits rather than reducing them all at once: it’s just a change in the benefits schedule. The state of Ohio did it recently with child care benefits, albeit in a convoluted way by only allowing the phase-out range to apply to previous recipients (take your kid out of child care for a month and get a raise? Lose your benefit) and thus building in a strange incentive for benefit continuity. That being said, the new program creates less negative incentives than the last. Smart design can prevent these problems from occurring in the first place.

States are more hamstrung with federal programs like SNAP which have strict income cutoffs which states generally don’t have the flexibility to change. This is where states need to get creative. Case management combined with targeted cash or in-kind transfers can help supplement income when benefits disappear, creating bridges towards sustainable middle-class incomes. But the best way to deal with a benefits cliff is to make sure it doesn’t exist in the first place, which means good design at the onset of a program.

Rob Moore is the principal for Scioto Analysis.

Ohio's Water Quality Still Lags Other States

Last year, Scioto Analysis conducted a study of Ohio’s economy using an alternative, “GDP+” framework called the “genuine progress indicator”. This was the first Genuine Progress Indicator study in Ohio since 2012 and tracked Ohio’s recovery from the Great Recession, calculating the size of the economy in every year from 2009 to 2016 using 26 different economic, environmental, and social indicators.

That same year, researchers at the University of Vermont calculated a “point-in-time” measure for all fifty states for the year 2011. The nice thing about this report is that we can use this data to compare Ohio’s economy compared to the economy of the other 49 states.

On most indicators, Ohio is characteristically pedestrian, falling within half a standard deviation of the state mean per-capita cost or benefit. For four indicators, though, Ohio deviates from the average state, and all but one of these are in a negative direction.

Water Pollution
Ohio’s worst indicator compared to other states is water pollution. The cost of water pollution to the average state resident in Ohio in 2011 was $219 compared to $139 for the average state, one and a half standard deviations higher than the mean. This should not be surprising for those who lived through the Cuyahoga River Fire, but these numbers show that Ohio’s water pollution struggles are far from ancient history. Water quality has become a problem recently as algae blooms in Lake Erie and other lakes have cost Ohioans in property values, tourism industry, and natural resources. University of Toledo Economist Kevin Egan has proposed a phosphorus tax to capture the cost of runoff where it begins, but state policymakers have shied away from the proposal, leaning towards regulations and education.

Personal Consumption
The largest portion of the genuine progress indicator is personal consumption expenditures, or consumer spending on goods and services, which makes up over a third of gross impacts in the measure. The average Ohioan spent about $31,000 on goods and services in 2011, compared to about $34,000 for the average state, making this also the largest single shortfall for Ohio compared to other states in absolute terms, but also among the highest in relative terms as Ohio’s personal consumption expenditures per capita were three-quarters of a standard deviation lower than the average state. This may be a symptom of higher poverty and lower incomes in Ohio than the average state.

Motor Vehicle Crashes
The bright spot in this report is that Ohio experiences less motor vehicle crashes than the average state. In 2011, Ohio had about 9 fatal crashes per 100,000 people, compared to the average state that had 12 fatal crashes per 100,000 people (about two-thirds of a standard deviation lower). This means Ohio had less medical costs, time lost at work, and most importantly deaths per person than the average state, leading to savings of about $1,500 per person. It’s hard to say exactly what is causing the lower crash levels in Ohio, but with Wyoming, North Dakota, and Montana all experiencing the higher rates of over 20 fatal crashes per 100,000 people, it may have to do with density or speed limits.

Higher Education Attainment
Back to the bad news: Ohioans are generally less educated than the average state. In 2011, about 25% of Ohio’s adult population had a bachelor’s degree or higher, compared to about 28% for the average state, which makes Ohio’s attainment rate about half a standard deviation lower than the average. This leads to an a lost $400 per capita in greater civic engagement, longer life expectancy, better child education, and more optimal family sizes. This may owe to Ohio’s history as an industrial state and its reliance on industries that require less education than others. If Ohio’s higher education attainment rate was the same as the average state, Ohio would have about a quarter million more bachelor’s degrees in its workforce. The Ohio Department of Higher education has set a goal to reach 65% attainment of working-age degree, certificate, or workforce credentials by 2025, which could mean a half million more bachelor’s degrees in the state workforce.

Ohio doesn’t do terribly in this comparative analysis, but it does provide room for improvement: Ohio has models in other states that have less water pollution, stronger consumer economies, and more educated workforces. Ohio should be happy, though, that motor vehicle crashes are not as bad as they are in other states. One limitation of this data, though, is that the most recent study only captured information from 2011. Ideally, the federal government, through the US Bureau of Economic Analysis, would conduct a 50-state analysis of state genuine progress indicators every year. Until then, we will lean on independent analyses done by the University of Vermont, Scioto Analysis, and other firms to provide us with this key economic information.

Scioto Analysis Partners with Nebraska Disability Groups on Study

On Tuesday, Disability Rights Nebraska and the Nebraska Consortium for Citizens with Disabilities released a study with Scioto Analysis on Nebraska’s waiting list for developmental disability services.

Citizens with disabilities in Nebraska are entitled to receive residential, habilitation, and vocational services from the state, but the state does not always provide these services at the time of need for people with disabilities. Because of these delays, the average Nebraskan with disabilities waits nearly seven years to receive services from the state necessary for everyday functioning.

“Nebraska has a strong history of investing in educational, medical and related services and supports for children and youth with disabilities from date of diagnosis through age twenty-one,” said Disability Rights Nebraska Chief Executive Officer Eric Evans, Ph.D. “Despite this commitment to young Nebraskans with intellectual/developmental disabilities, today over 2,300 children, youth and adults are waiting for essential services beyond their need date.”

The study found that the state has made strides on developmental disabilities, but fell short of legislative workgroup recommendations for developmental disability funding by about $33 million over the past ten years, causing the backlog.

“If the state had not had this shortfall in spending, this wait list would not exist,” said Scioto Analysis Principal and study author Rob Moore.

This study will inform Disability Rights Nebraska and the Nebraska Consortium for Citizens with Disabilities’s efforts to reduce the waiting list and improve access to services for people with developmental disabilities in the state of Nebraska.

Ohio in the Middle of the Pack in Higher Education Spending

Last week, the Pew Charitable Trusts released an issue brief on U.S. higher education funding. In this brief, the Trusts presented some valuable information on state-level education spending.

Using this data, we can compare higher education spending in Ohio to higher education spending in neighboring states.

Ohio is fairly middle of the pack when looking at per-student spending on higher education. Ohio spends about $10,000 more per student than Indiana and West Virginia and about $10,000 less per student than Michigan and Pennsylvania. Ohio’s per-student spending is closer to Kentucky, which spends about $2,500 more per student than Ohio. This is a little surprising since Kentucky is more poor and Indiana is more wealthy than Ohio as a whole.

Data from the Pew Charitable Trusts

Data from the Pew Charitable Trusts

Ohio falls in the same place in the pecking order when just looking at per-student tuition costs, with tuition in Ohio a few thousand more than in Kentucky and a few thousand less than in Pennsylvania. Here, though, you see higher education spending rates more matching poverty rates, with Kentucky and West Virginia charging less for tuition and Pennsylvania more.

Data from the Pew Charitable Trusts

Data from the Pew Charitable Trusts

Michigan is a bit different than you would expect, though, with higher tuition despite being a medium-poverty state for the area. While Michigan and Ohio’s median incomes and poverty rates are both nearly identical to one another, college tuition is much higher in Michigan than in Ohio.

Tax spending, or state revenue spent on higher education, is a different picture. Here, you see Kentucky and West Virginia spending more of their state taxes on higher education than Michigan and Pennsylvania, suggesting that Michigan and Pennsylvania lean more on student tuition to fund higher education while Kentucky and West Virginia fund more of their higher education through taxes. Indiana is the exception here, putting forth more tax revenue and charging higher tuition than the average state in the region. Ohio, like other measures, is middle of the road.

Data from the Pew Charitable Trusts

Data from the Pew Charitable Trusts

Federal revenue is the only category where Ohio falls behind each of its neighboring states, only bringing in about $3,400 in federal revenue per student. Interestingly, Michigan and Pennsylvania, which have the highest tuitions and contribute the least in state taxes towards higher education, also receive the most per-student in federal funding. This is likely because of federal research grants, which tend to be won by top-tier research institutions, which are more common in Michigan and Pennsylvania than other states in the region.

Data from the Pew Charitable Trusts

Data from the Pew Charitable Trusts

Since the economic benefits of basic research are more likely to bleed across state lines than human capital from higher education, this trend follows sound economic logic. That being said, federal dollars also include financial aid dollars, so this suggests that research dollars are overwhelming financial aid dollars in these states. From a local standpoint, these numbers also show that Ohio is a less attractive place for the federal government to invest its resources than any of its neighboring states.

Disparities in funding become very clear when looking at the impacts of private gifts and investments on state higher education funding. Ohio only draws about half as much income on a per-student basis from gifts and investments as Michigan does. For Kentucky, that number is only about a quarter.

Data from the Pew Charitable Trusts

Data from the Pew Charitable Trusts

Finally, let’s look at the oddest category of revenue: self-supporting operations. Self-supporting operations include revenue from the operation of campus services (e.g., residence halls, intercollegiate athletics, and college stores), hospitals, and independent operations. While Ohio generates a few thousand dollars per student less in self-supporting operations than Kentucky, Pennsylvania, or Michigan, it generates much more than Indiana and West Virginia, which each only generate about $4,000 in self-supporting operations revenue per student. This suggests that either on-campus amenities or independent operations such as hospitals are dramatically less prominent in Indiana and West Virginia than the other four states in the region.

Data from the Pew Charitable Trusts

Data from the Pew Charitable Trusts

Overall, the most striking pattern in this data is Ohio’s normality. In nearly every category, Ohio falls in the middle of the region, with the notable exception of federal funding. This suggests that Ohio could do more to bolster its work as a research state, though it could also suggest a focus on teaching in the state over research. Another explanation is that the state may be doing less than other states to help students take advantage of federal financial aid, which, if true, could exacerbate inequality in the state.

Why Preschool Teacher Wages are So Low

People have been talking for years about wages for early childhood educators. Preschool teachers in Ohio last year made an average of less than half the wage of K-12 teachers. The average preschool teacher’s salary only amounts to 112% of the federal poverty level for a family of four, meaning that many preschool teachers are likely below the poverty line and most are low-income.

This seems counterintuitive given the research available on the returns to early childhood education compared to interventions later in life.

The other side of this conversation, though, is the cost of early childhood education. A recent study by the RAND corporation suggests that high-quality early childhood education education costs anywhere from $3,600 per student to $13,400 per student. This means the average worker in Ohio making $48,000 a year would have to spend 7-28% of income per child on early childhood education.

Labor makes up a considerable portion of the cost of child care, with estimates in the range of 60-80% of total program costs going to teacher salary and benefits. Using the RAND estimates of the cost of high quality early education, we can then estimate that teacher salary and benefits cost anywhere from $2,200 to $10,700 per student.

Using the above Bureau of Labor Statistics data, we can see that kindergarten and elementary school teachers are each paid more than twice as much as preschool teachers. This means that increasing preschool teacher wages to kindergarten or elementary parity would increase teacher salary and benefit costs to $4,000 to $23,000 per student and total costs (assuming equipment, administration, and occupancy costs stay the same) to $6,000 to $26,000 per student per year. This increases the per-child burden of early education to anywhere from 12-53% of the median wage in Ohio.

The Federal Department of Health and Human Services has previously established seven percent of family income as a benchmark for child care affordability. This means families up to $190,000 in family income (nine times the federal poverty level) could be considered cost burdened by child care under high estimates of the cost of child care. A flat per-child subsidy capping costs per child at seven percent and assuming an average cost of care of $8,500 would extend up to families making $120,000 per year (six times the federal poverty level), while a per-child subsidy aiming to increase teacher wages to elementary school levels would extend to families making up to $230,000 per year (11 times the federal poverty level).

SubsidySchedule.jpg

According to the Annie E. Casey Foundation, there were 690,000 children in Ohio age 0-4 in 2018. A subsidy capping the per-child cost of care at seven percent of income would cost an average of about $5,000 per child at current costs and $12,000 per child at a subsidy aiming to increase teacher wages. An age 0-4 subsidy program capping per-child costs at 7% of family income in the state of Ohio would cost about $3.6 billion at current costs and $8.6 billion at costs aiming to increase teacher wages. For reference, the state of Ohio spent $2.5 billion on higher education and $7.5 billion on K-12 education in 2018. This means that a current-costs subsidy to cap per-child expenses at 7% of income would have cost the state more than any other state program besides K-12 education and Medicaid ($16 billion in 2018) and a subsidy program aimed at boosting teacher wages would cost the state more than any program besides Medicaid.

The dilemma of child care public finance is pretty clear: increasing teacher wages drives up the cost of care, which has to be either picked up by families or by the state. From an economic perspective, this makes perfect sense: if the social benefits of early childhood are sufficiently high, we should see underinvestment in the early childhood market without sufficient public sector intervention. States can choose two of the three options between high wages for teachers, low costs for families, and low levels of state spending. Having all three can only occur through outside federal investment financed by either new taxes or further deficit spending.

Scioto Analysis Principal Rob Moore Profiled in APPAM's "Five Minutes With..." Series

Last week, Scioto Analysis Principal Rob Moore was profiled in the Association for Public Policy Analysis and Management’s “Five Minutes With…” series.

In the interview, Moore talked about what attracted him to the field of public policy analysis.

“Policy analysis is a great place for people who have the engineering mindset but an interest in making society as a whole better,” said Moore.

Moore also spoke about analysis’s place in the democratic process.

“In a democracy, interest groups and public opinion have a role, but good policy requires political interests to be balanced with facts about the impacts of policy,” Moore said. “Scioto Analysis is a firm that provides these facts to policymakers who want them and promotes better analysis at the state and local level.”

Moore went on to talk about the future of public policy, talking about the rise of equity analysis and the growth in cross-disciplinary analysis.

“Over the next thirty years or so, I expect public policy to improve its rigor and expand its insights in the fields of human development and well-being,” said Moore. “If we can better understand how policies impact development metrics such as education, health, and housing and food security along with subjective assessment of well-being, we can craft policy that responds not only to the classical economic concept of getting people what they want but also to helping people live independent, fulfilling lives.”

The Association for Public Policy Analysis and Management is the leading association for public policy analysts, managers, and researchers in the United States. Made up of over 2,500 members, the association is dedicated to improving public policy and management by fostering excellence in research, analysis, and education.

What does “give people money" really look like?

During his presidential campaign, tech entrepreneur Andrew Yang has brought an old/new idea to the foreground of public policy: basic income. Yang’s “Freedom Dividend” is the most high-profile basic income proposal since Richard Nixon’s Family Assistance Plan.

But giving everyone in America $1,000 dollars a month isn’t the only way to fight poverty. As a matter of fact, it’s not the only way to give people cash.

The most common way we give working people cash in the United States is through the Earned Income Tax Credit. The Earned Income Tax Credit is a tax credit given to working people under a certain income threshold. The credit is limited to working people by increasing in generosity at the lower end of the income distribution, leveling off, then decreasing as people make more income. Below, you can see what an Earned Income Tax Credit could look like maxing out at $1,000 a month.

Figure 1: Earned Income Tax Credit Model

Figure 1: Earned Income Tax Credit Model

Currently, the federal government, 29 states, DC, Guam, and Puerto Rico all have versions of the Earned Income Tax Credit. Scioto Analysis conducted a cost-benefit analysis last summer on Ohio’s Earned Income Tax Credit and has analyzed recent Earned Income Tax Credit changes in the state of Ohio. As an antipoverty tax break that encourages work originally passed by a Democratic Congress and signed by a Republican President, the Earned Income Tax Credit has traditionally enjoyed bipartisan support.

Older than the Earned Income Tax Credit is guaranteed income, also known as a “negative income tax.” Famously trumpeted by Milton Friedman as a solution for administrative waste in the social welfare system in the United States, guaranteed income provides an “income floor” for low-income people then draws down as people make more money.

Figure 2: Guaranteed Income Model

Figure 2: Guaranteed Income Model

Guaranteed income provides more support for people at the bottom of the income distribution than the earned income tax credit and does not pull people into the workforce the same way that the earned income tax credit does. A guaranteed income was proposed by Richard Nixon in the early 70s and even passed the House of Representatives but stalled in the Senate and never became law.

A newer proposal that turns the guaranteed income concept on its head is the “Universal Earned Income Tax Credit” proposed by Syracuse University Economist Leonard Burman. Rather than starting with a grant and then taking it away as income goes up, the Universal Earned Income Tax Credit gives cash as income goes up and never takes it away as incomes increase.

Figure 3: Universal Earned Income Tax Credit Model

Figure 3: Universal Earned Income Tax Credit Model

The universal earned income tax credit would encourage low income people to work while supplementing their incomes and would not be very targeted, going to a lot of high-income people as well as low-income people. Nothing like the universal earned income tax credit has been implemented before.

Lastly, universal basic income. Universal basic income is a no-strings-attached, no phase-in, no phase-out cash transfer to all people. Universal basic income has picked up in the public policy conversation over the past few years fueled by both poverty advocates and Silicon Valley futurists worried about the future of work.

Figure 4: Universal Basic Income Model

Figure 4: Universal Basic Income Model

Universal basic income has had pilots since the 1960s and is currently being tested in Finland and California. The most famous basic income in the world is probably the Alaska Permanent Fund, a fund financed by Alaskan oil revenues that makes direct payments to all Alaskans in the state, regardless of income.

Graphic from Business Standard

Graphic from Business Standard

Another variation worth noting is a conditional cash transfer. Conditional cash transfers are usually targeted to geographic areas of need and are awarded on condition of completing socially beneficial activities such as school attendance, primary care screenings, and vaccinations. Since they usually do not interact with other income, they work much like a universal basic income in theory with an added incentive to carry out the conditions of the benefit. Conditional cash transfers are much more common in middle- and low-income countries and the Global South.

Giving $1,000 a year to every person is one way to do cash transfers, but it is hardly the only way. The earned income tax credit, guaranteed income, universal earned income tax credit, universal basic income, and conditional cash transfer approaches all have benefits and drawbacks. They all share one big benefit, though: providing families who need them cash to deal with the contingencies of life.