It’s fall again and like most years, Ohio is king when it comes to college football. But fall in the wonk world means something different: new poverty statistics.
Last week, the United States Census Bureau released new data on income, poverty, and health insurance coverage at the state and local level across the United States. The release was data from the American Community Survey, the preview survey of US population, workforce, and housing.
This new data gives us a snapshot of Ohio’s poverty rate compared to other states. The national poverty rate in 2018 was 13.1%, a mark only beat by Pennsylvania (12.2%) among Ohio and its neighbors. Indiana’s poverty rate was right at the national poverty rate while Michigan and Ohio’s were statistically identical at about a point above the national poverty rate. West Virginia and Kentucky had the highest poverty rates in the region and were respectively the fourth and sixth poorest states in the country.
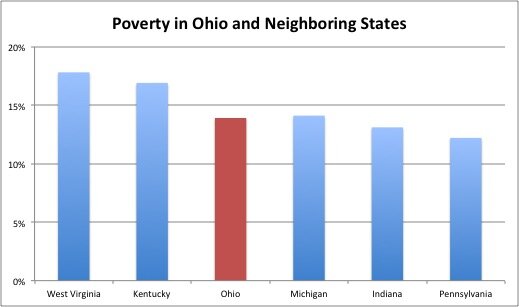
Data from U.S. Census Bureau’s American Community Survey
Rates of child poverty nationwide are higher than rates of working-age poverty, which are higher than rates of poverty for older adults. Looking at Ohio and its neighboring states, though, we can see that child and working-age poverty rates vary more wildly among states than older adult poverty rates. While child and working-age poverty rates are around 50% higher in West Virginia than in Pennsylvania, the older adult poverty rate is only 20% higher in West Virginia than it is in Pennsylvania. This might owe to the fact that the nation’s largest antipoverty program, social security, addresses poverty among older adults more than working-age adults and children.

Data from U.S. Census Bureau’s American Community Survey
Ohio and all its neighboring states have median household incomes lower than the national average. Median household income follows a similar pattern as poverty rates, with one major exception: Indiana has the second lowest poverty rate among Ohio and its neighboring states, but it has the fourth highest median income. This suggests Indiana has less inequality than Ohio and Michigan.

Data from U.S. Census Bureau’s American Community Survey
By splitting up households in these states into high-income, middle-income, and low-income households, we can learn something about the distribution of income among households. I split these households up using the Pew Research Center’s definition of “middle class”, two-thirds to twice the median income. This came out to households under $35,000 in annual income being classified as “low income,” households from $35,000 to $100,000 in annual income being classified as “middle income,” and households with greater than $100,000 in annual income being classified as “high income.”

Data from U.S. Census Bureau’s American Community Survey
There are so many takeaways from this chart. First, Ohio again looks dead similar to Michigan. Secondly, the middle-income population is fairly steady state to state, fluctuating between 42% of the total population in West Virginia and 47% of the total population in Indiana. By contrast, the high-income and low income populations fluctuate by 11 and 12 percentage points respectively between Pennsylvania and West Virginia.
Here you can see why Indiana has lower median income than Ohio and Michigan: it has the largest middle class of any state in the region. It also has the same proportion of low-income residents as Ohio and Michigan but less high-income residents.
Kentucky looks somewhat better using income measures than poverty measures. It has a lot of people in poverty, but also has more high-income people than West Virginia, making its distribution fall somewhere between West Virginia and Ohio/Michigan.
Finally, Pennsylvania is the only state where the high-income population nearly eclipses the low-income population. This coupled with its second-smallest middle class among states in the region suggests some persistent inequality despite having a smaller low-income population than all other states.
Using all these measurements, Ohio falls in the middle regionally when it comes to income and poverty, with higher incomes and lower poverty than West Virginia and Kentucky, lower incomes and higher poverty than Pennsylvania and Indiana, and identical in nearly every way to Michigan. Maybe they’re right when they say familiarity breeds contempt.