

In my previous blog posts, I’ve written a lot about how we can use American Community Survey data to learn about patterns and trends within the economy. Last month, I looked at who is moving out of Ohio and where they’re going. The month before that, I looked at affordability measures in Ohio, specifically focusing on the costs of housing across different counties in Ohio.

Analyzing trends of data is interesting, but we have to be careful not to equate correlation to causality. For example, last month, I found that older Ohioans tend to frequently move to warmer states like Florida and Texas, while younger Ohioans tend to move to bustling states with big cities like New York and Illinois. But without doing more in-depth analysis, it’s hard to say that people are moving to New York and Illinois because they’re young.
Another thing we can use American Survey data for is comparing population growth against different factors such as poverty, household income, educational attainment, and life expectancy. First, I wanted to look at how population growth trends compare to poverty rates across the United States.
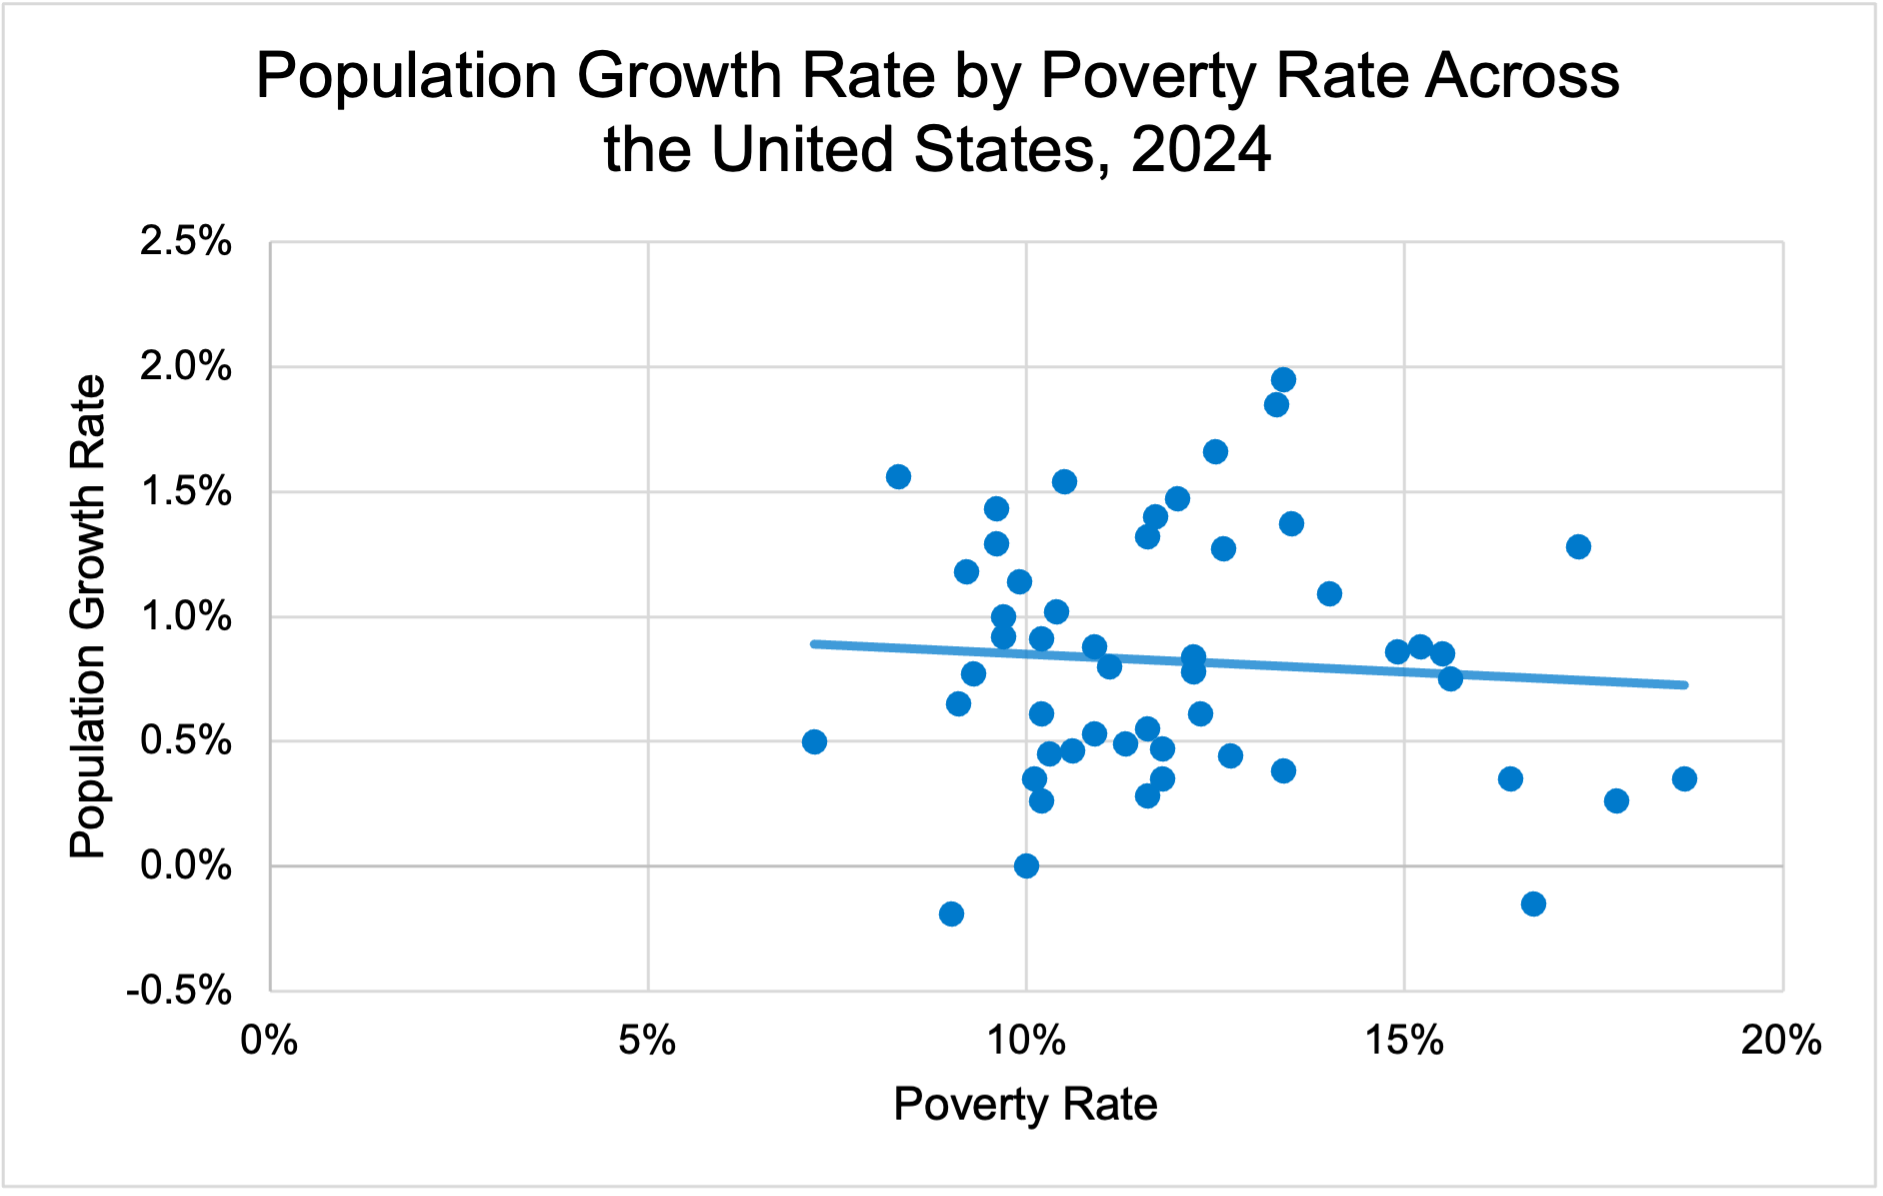
The figure above shows population growth rates compared to poverty rates across the United States in 2024. In 2024, there appears to be a negative correlation between poverty rates and population growth across the United States. That is, the lower the poverty rate is within a certain state, the higher we expect the population growth rate to be in that state. This would imply that as poverty rates improve within a certain state, residents are more likely to move to and remain in that state. This makes a lot of sense, especially given the current levels of discourse around affordability across the nation. While we can’t completely associate poverty with lack of affordability, we would expect people who are suffering from affordability across the nation to be driven to states with low poverty rates.
Alternatively, we could look at the relationship in the inverse direction. More people moving to a state could result in poverty rates going down. On one hand, this could simply be a matter of numbers: if the people moving to new states are already well-off, the rates of poverty could appear to be improving even if the actual number of people experiencing poverty isn’t changing. On the other hand, more people moving to a new state can stimulate local economies and increase state tax revenue which might be correlated with lower poverty rates. We should also consider that states with stronger economies tend to have lower poverty rates. People often want to move to these states not solely because of low poverty rates, but more often because of employment opportunities due to strong economies.
Some outliers to this trend are Vermont, which has a relatively low poverty rate of 9% while sustaining negative population growth, and the District of Columbia, which has one of the highest poverty rates of 17.3% and a stable population growth rate of 1.28%.
Another important metric we can look at is how median household income compares to population growth rates, shown in the figure below.
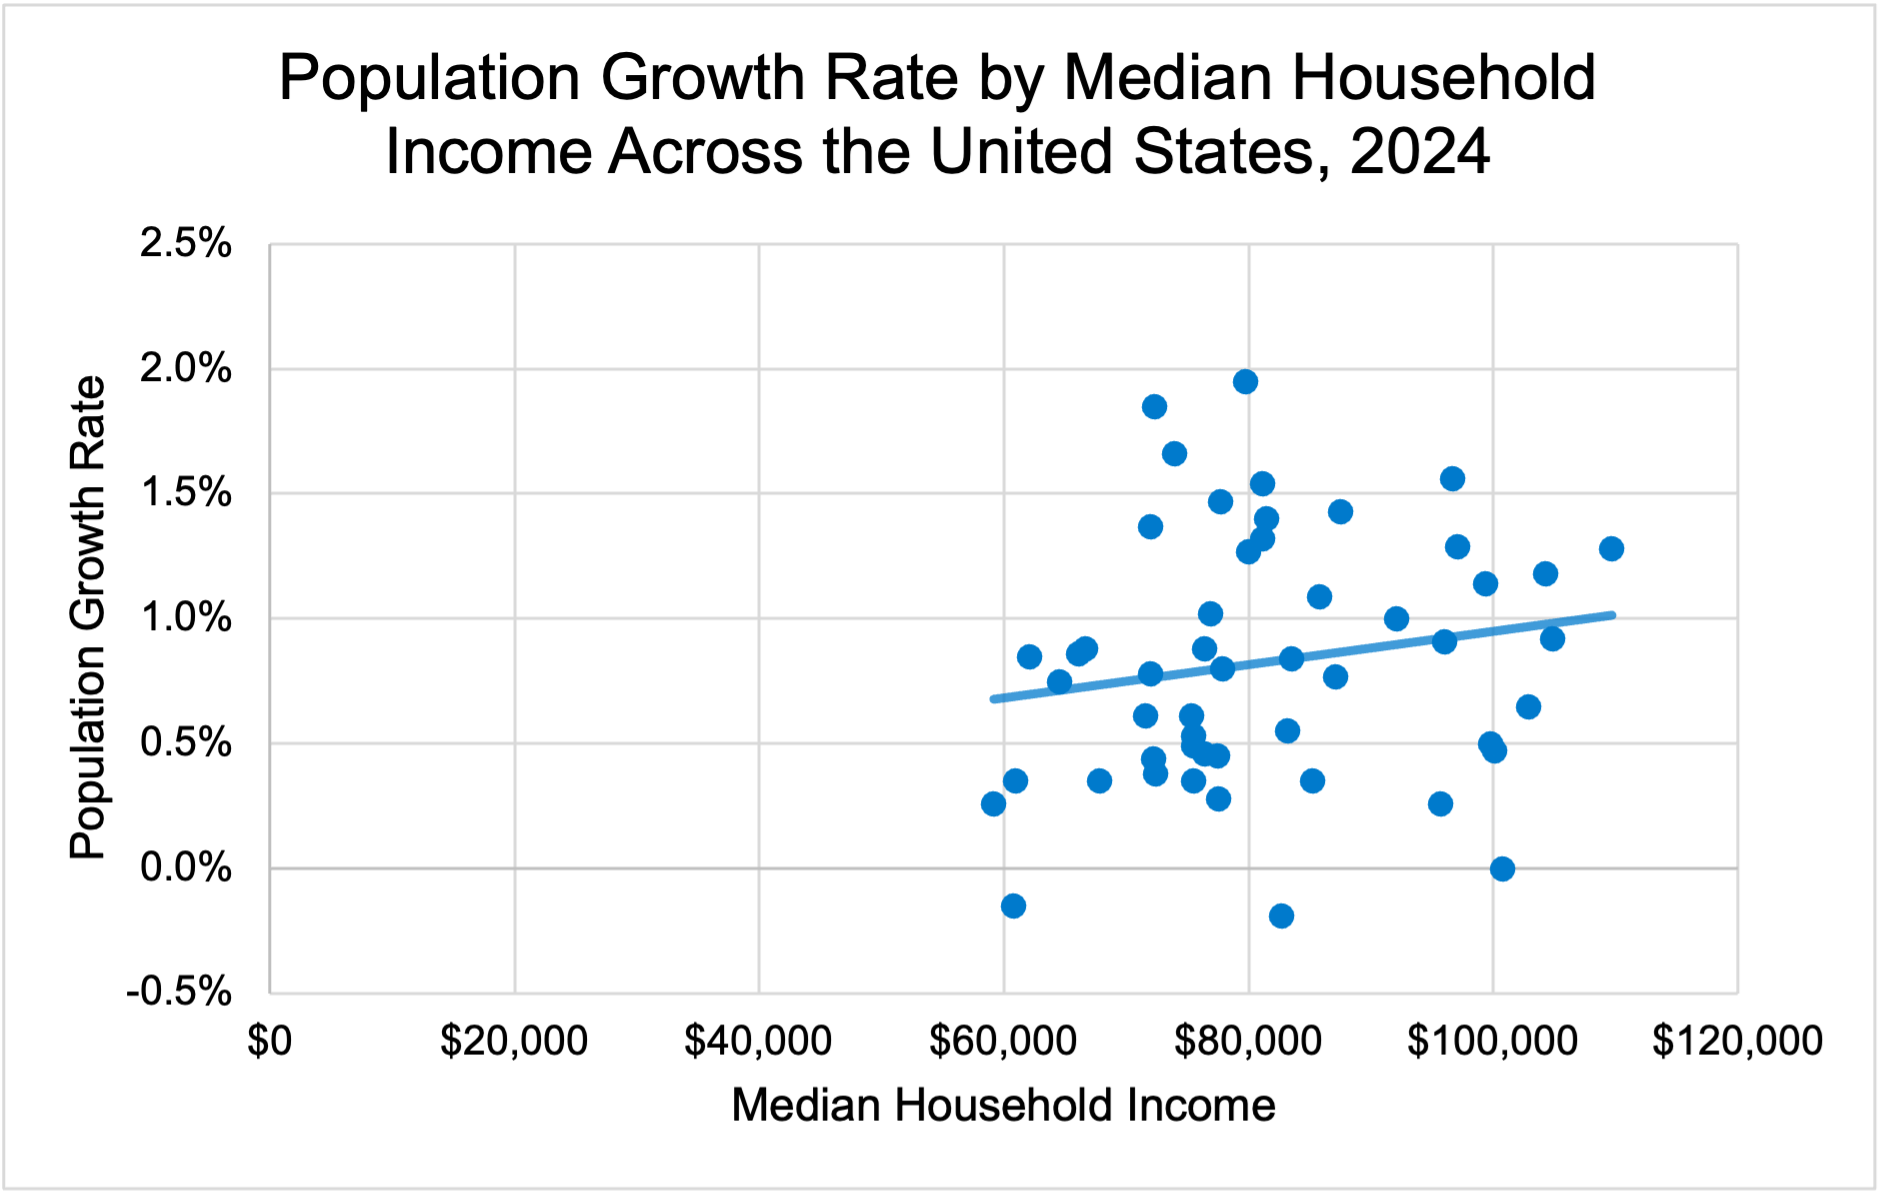
There appears to be a moderate correlation between median household income and population growth rate across the United States in 2024. This suggests that people are motivated to move to a new state if they have opportunities to earn a higher income. In the past, we have frequently found at Scioto Analysis that employment opportunities are one of the largest drivers of population growth. Better employment opportunities give potential movers a tangible benefit of them moving: a higher income in their pocket each month. However, there is an interesting trend present in the graph: most of the states that have the highest population growth rates are clustered near the middle of states ranked by median household income. These are states like Texas, South Carolina, and Florida, where it could be the case that new graduates are flocking to these states for a relatively higher starting wage.
The third metric I compare to population growth rates is educational attainment, which is shown in the figure below.
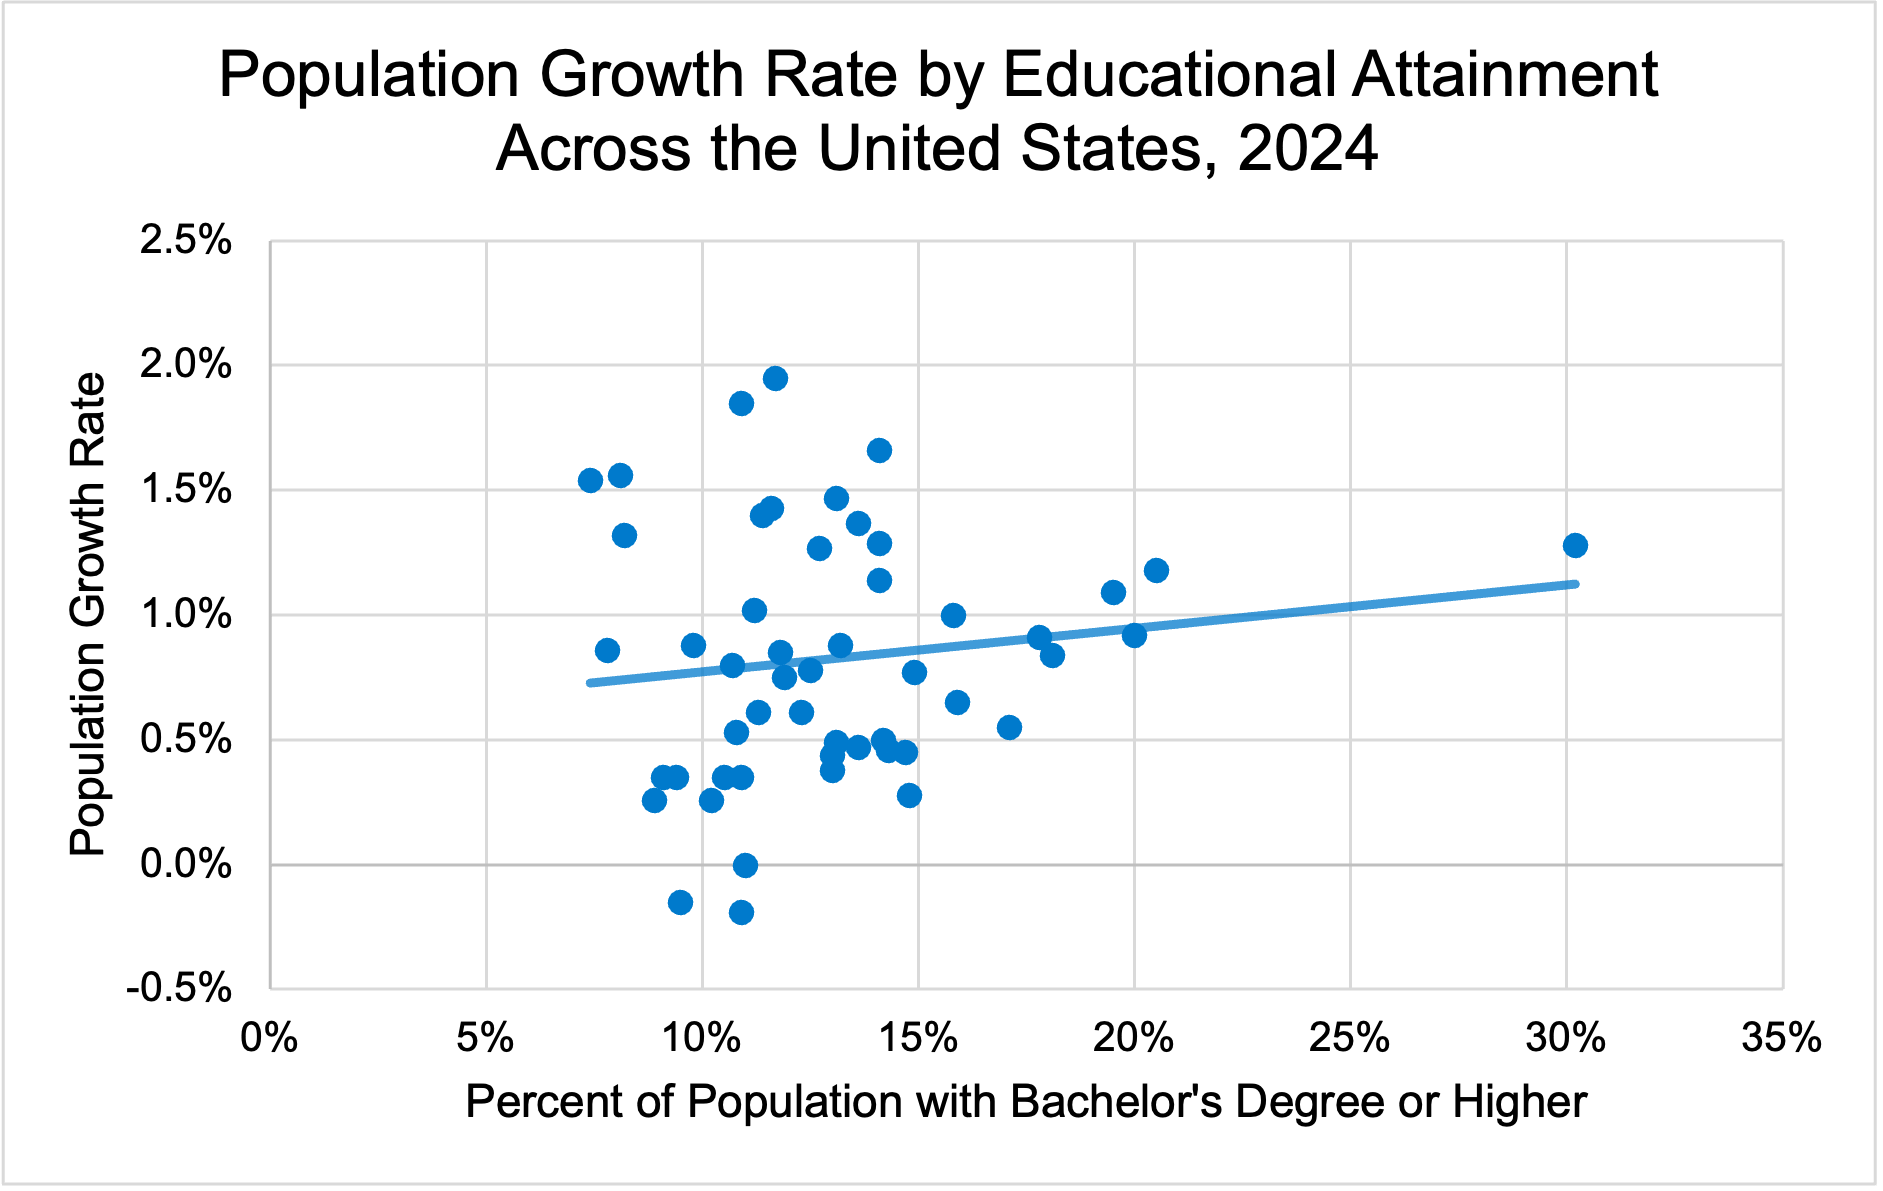
The story we get from this graph is similar to the last one– the more educated a state is, the higher its population growth rate is. The first thing this trend suggests to me is that the majority of people moving states are people with a bachelor’s degree or higher. As the population across different states increases, the percentage of the population with a bachelor’s degree or higher increases too because those are the kinds of people who are moving to different states to begin with.
There could also be some sort of intrinsic argument relating educational attainment to quality of life. States with higher educational attainment often have higher life expectancies and economic prosperity. Perhaps due to a higher quality of life, more people are driven to more highly educated states. I would expect reality to fall somewhere in between these two explanations: people with higher educational attainment are likely moving to states with good employment opportunities and higher wages.
The last variable I compare to population growth rates is life expectancy, shown in the figure below.
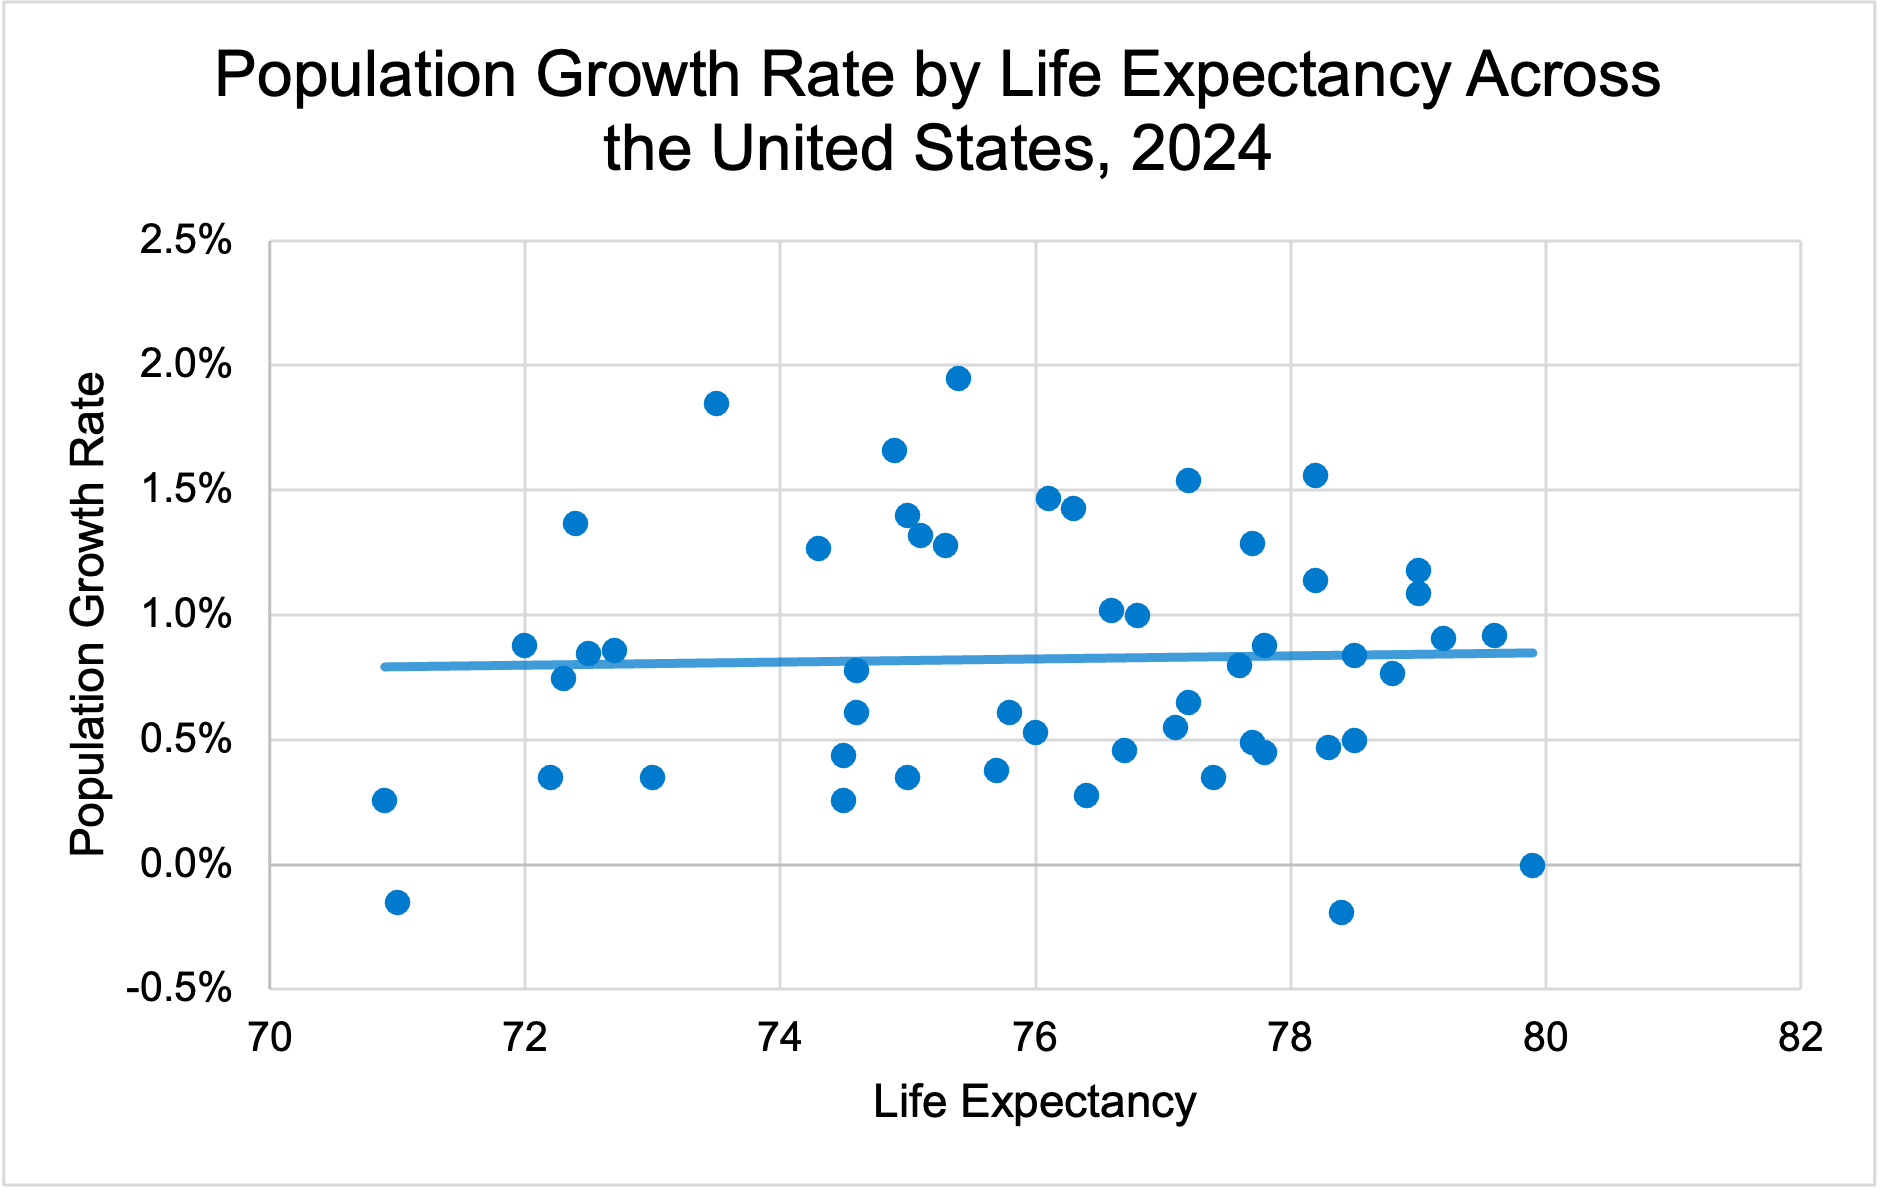
Life expectancy is the first of our variables to have little to no correlation with population growth rates. If anything, there is a small positive correlation between life expectancy and population growth rates across the United States, though it is too small to draw any major conclusions from. I find the lack of correlation between life expectancy and population growth rates to make sense. Poverty rates, household income, and educational attainment are all variables that potential movers can observe with relative ease. If a state has low poverty rates, high median income, and high educational attainment, I would expect people to be drawn to those states– they can benefit from those sorts of positive metrics in the short-run.
On the other hand, life expectancy is more abstract. It’s harder to say for sure what actually causes differences in life expectancy between states, and it’s even harder to believe that moving to a new state would have a drastic impact on an individual person’s life expectancy.
It could also be the case that life expectancy numbers are skewed from the COVID-19 pandemic– perhaps if we looked at life expectancy compared to population growth rate trends ten years ago, the results would look completely different.
More in-depth analysis is necessary to establish causality between any of our variables and population growth, but analyzing scatterplots and correlation can provide an understanding of the direction of different variables within the economy. People seem to be moving to states with lower poverty rates, higher median wages, and higher rates of educational attainment, all things we would expect from people looking to move to a new state seeking betterment.