Since the early 20th century, economists have favored taxing activities with negative spillover effects. While economists call these taxes “Pigouvian Taxes” after the early 20th century economist Arthur Cecil Pigou who first proposed them, they have a more moralistic name in the media today: “sin taxes.”

In recent years, Cuyahoga County and Cleveland officials have considered asking voters to triple, or even quadruple, alcohol and tobacco tax rates in the area. My colleague Rob wrote about Governor DeWine’s proposal to increase tobacco taxes back in 2025. In Cleveland, tobacco taxes help fund its three major sports stadiums, and with a new Cleveland Browns stadium most likely on the horizon in the near future, tax revenue from taxes on alcohol and tobacco in Cleveland may become increasingly valuable for stabilizing local finances.
A “sin tax” is an excise tax on a good or service that is deemed harmful to society in some sort of way. The term “sin taxes” most commonly refers to taxes on alcohol and tobacco, but more recently, the definition has expanded to cannabis and sports gambling as well. Alcohol and tobacco taxes are a form of “Pigouvian taxation,” the idea that we should tax economic transactions that have negative externalities that cause harm to others, such as health issues or financial trouble.
Local officials argue that since Cleveland’s alcohol and tobacco rates haven’t changed since 1990, it’s time for an inflationary adjustment. However, funding the new Cleveland Browns stadium through public tax dollars has been overwhelmingly unpopular among residents, suggesting that increasing taxes on alcohol and tobacco is unlikely to see success on a ballot. Plus, people like to smoke cigarettes and drink alcohol, so why would they want to increase the prices they pay for them?
Reading about alcohol and tobacco taxes in Ohio got me thinking: is it typical for states to rely so heavily on these kinds of taxes for major infrastructure projects? And if so, which states rely most heavily on these taxes for their tax budgets, and where does Ohio rank within them?
Sin taxes across the United States
Each year, the United States Census Bureau releases data tables about state and local government finances, with the most recent data available being from 2023. We can use these data tables to determine which taxes contribute the most to each state’s tax revenue.
The table below shows the total amount of tax revenue generated from taxes on alcohol, tobacco, and gambling across the United States and the proportion of total state tax revenue that these taxes account for in each state.
| Alcohol, Tobacco, and Gambling Taxes by State | ||
| State | Total Alcohol, Tobacco, and Gambling Taxes | % of State Tax Revenue |
|---|---|---|
| New Hampshire | $230,454,000 | 1.48% |
| Oklahoma | $586,307,000 | 1.11% |
| Tennessee | $812,548,000 | 1.00% |
| Alaska | $159,761,000 | 0.98% |
| Rhode Island | $155,213,000 | 0.95% |
| Kentucky | $535,118,000 | 0.88% |
| Pennsylvania | $1,595,478,000 | 0.87% |
| Wisconsin | $617,771,000 | 0.86% |
| Arkansas | $319,760,000 | 0.85% |
| Delaware | $137,090,000 | 0.85% |
| Maine | $154,919,000 | 0.83% |
| Texas | $3,006,921,000 | 0.82% |
| Montana | $115,819,000 | 0.81% |
| Vermont | $87,235,000 | 0.80% |
| West Virginia | $190,489,000 | 0.80% |
| Minnesota | $670,860,000 | 0.79% |
| North Carolina | $997,948,000 | 0.76% |
| Alabama | $514,549,000 | 0.76% |
| Michigan | $939,852,000 | 0.74% |
| South Dakota | $73,573,000 | 0.73% |
| Kansas | $281,908,000 | 0.70% |
| Illinois | $1,288,989,000 | 0.70% |
| Connecticut | $354,194,000 | 0.66% |
| Washington | $819,687,000 | 0.65% |
| Ohio | $961,630,000 | 0.64% |
| Oregon | $434,060,000 | 0.59% |
| Nevada | $217,703,000 | 0.58% |
| Maryland | $477,986,000 | 0.54% |
| Hawaii | $132,051,000 | 0.53% |
| Virginia | $619,201,000 | 0.52% |
| Georgia | $631,853,000 | 0.52% |
| Florida | $1,332,233,000 | 0.51% |
| Colorado | $407,627,000 | 0.50% |
| South Carolina | $345,970,000 | 0.50% |
| Louisiana | $322,743,000 | 0.49% |
| Indiana | $431,001,000 | 0.49% |
| New Jersey | $678,047,000 | 0.47% |
| Mississippi | $169,652,000 | 0.46% |
| Iowa | $203,529,000 | 0.43% |
| Massachusetts | $464,359,000 | 0.40% |
| Arizona | $347,834,000 | 0.39% |
| California | $2,055,608,000 | 0.29% |
| Nebraska | $83,440,000 | 0.28% |
| New York | $1,178,496,000 | 0.27% |
| Idaho | $52,892,000 | 0.26% |
| Utah | $124,092,000 | 0.26% |
| North Dakota | $33,457,000 | 0.24% |
| Missouri | $173,673,000 | 0.23% |
| New Mexico | $106,051,000 | 0.22% |
| Wyoming | $22,098,000 | 0.18% |
| District of Columbia | $16,199,000 | 0.07% |
The five states that generate the most tax revenue through these taxes are Texas, California, Pennsylvania, Florida, and Illinois. This is mostly a story about each state’s population and concentration of large cities.
To better understand which states rely the most on alcohol, tobacco, and gambling taxes, we should look at the proportion of state tax revenue that these taxes contribute to. The figure below shows a heat map of which states rely the most on alcohol, tobacco, and gambling taxes as a proportion of their total state tax revenues.
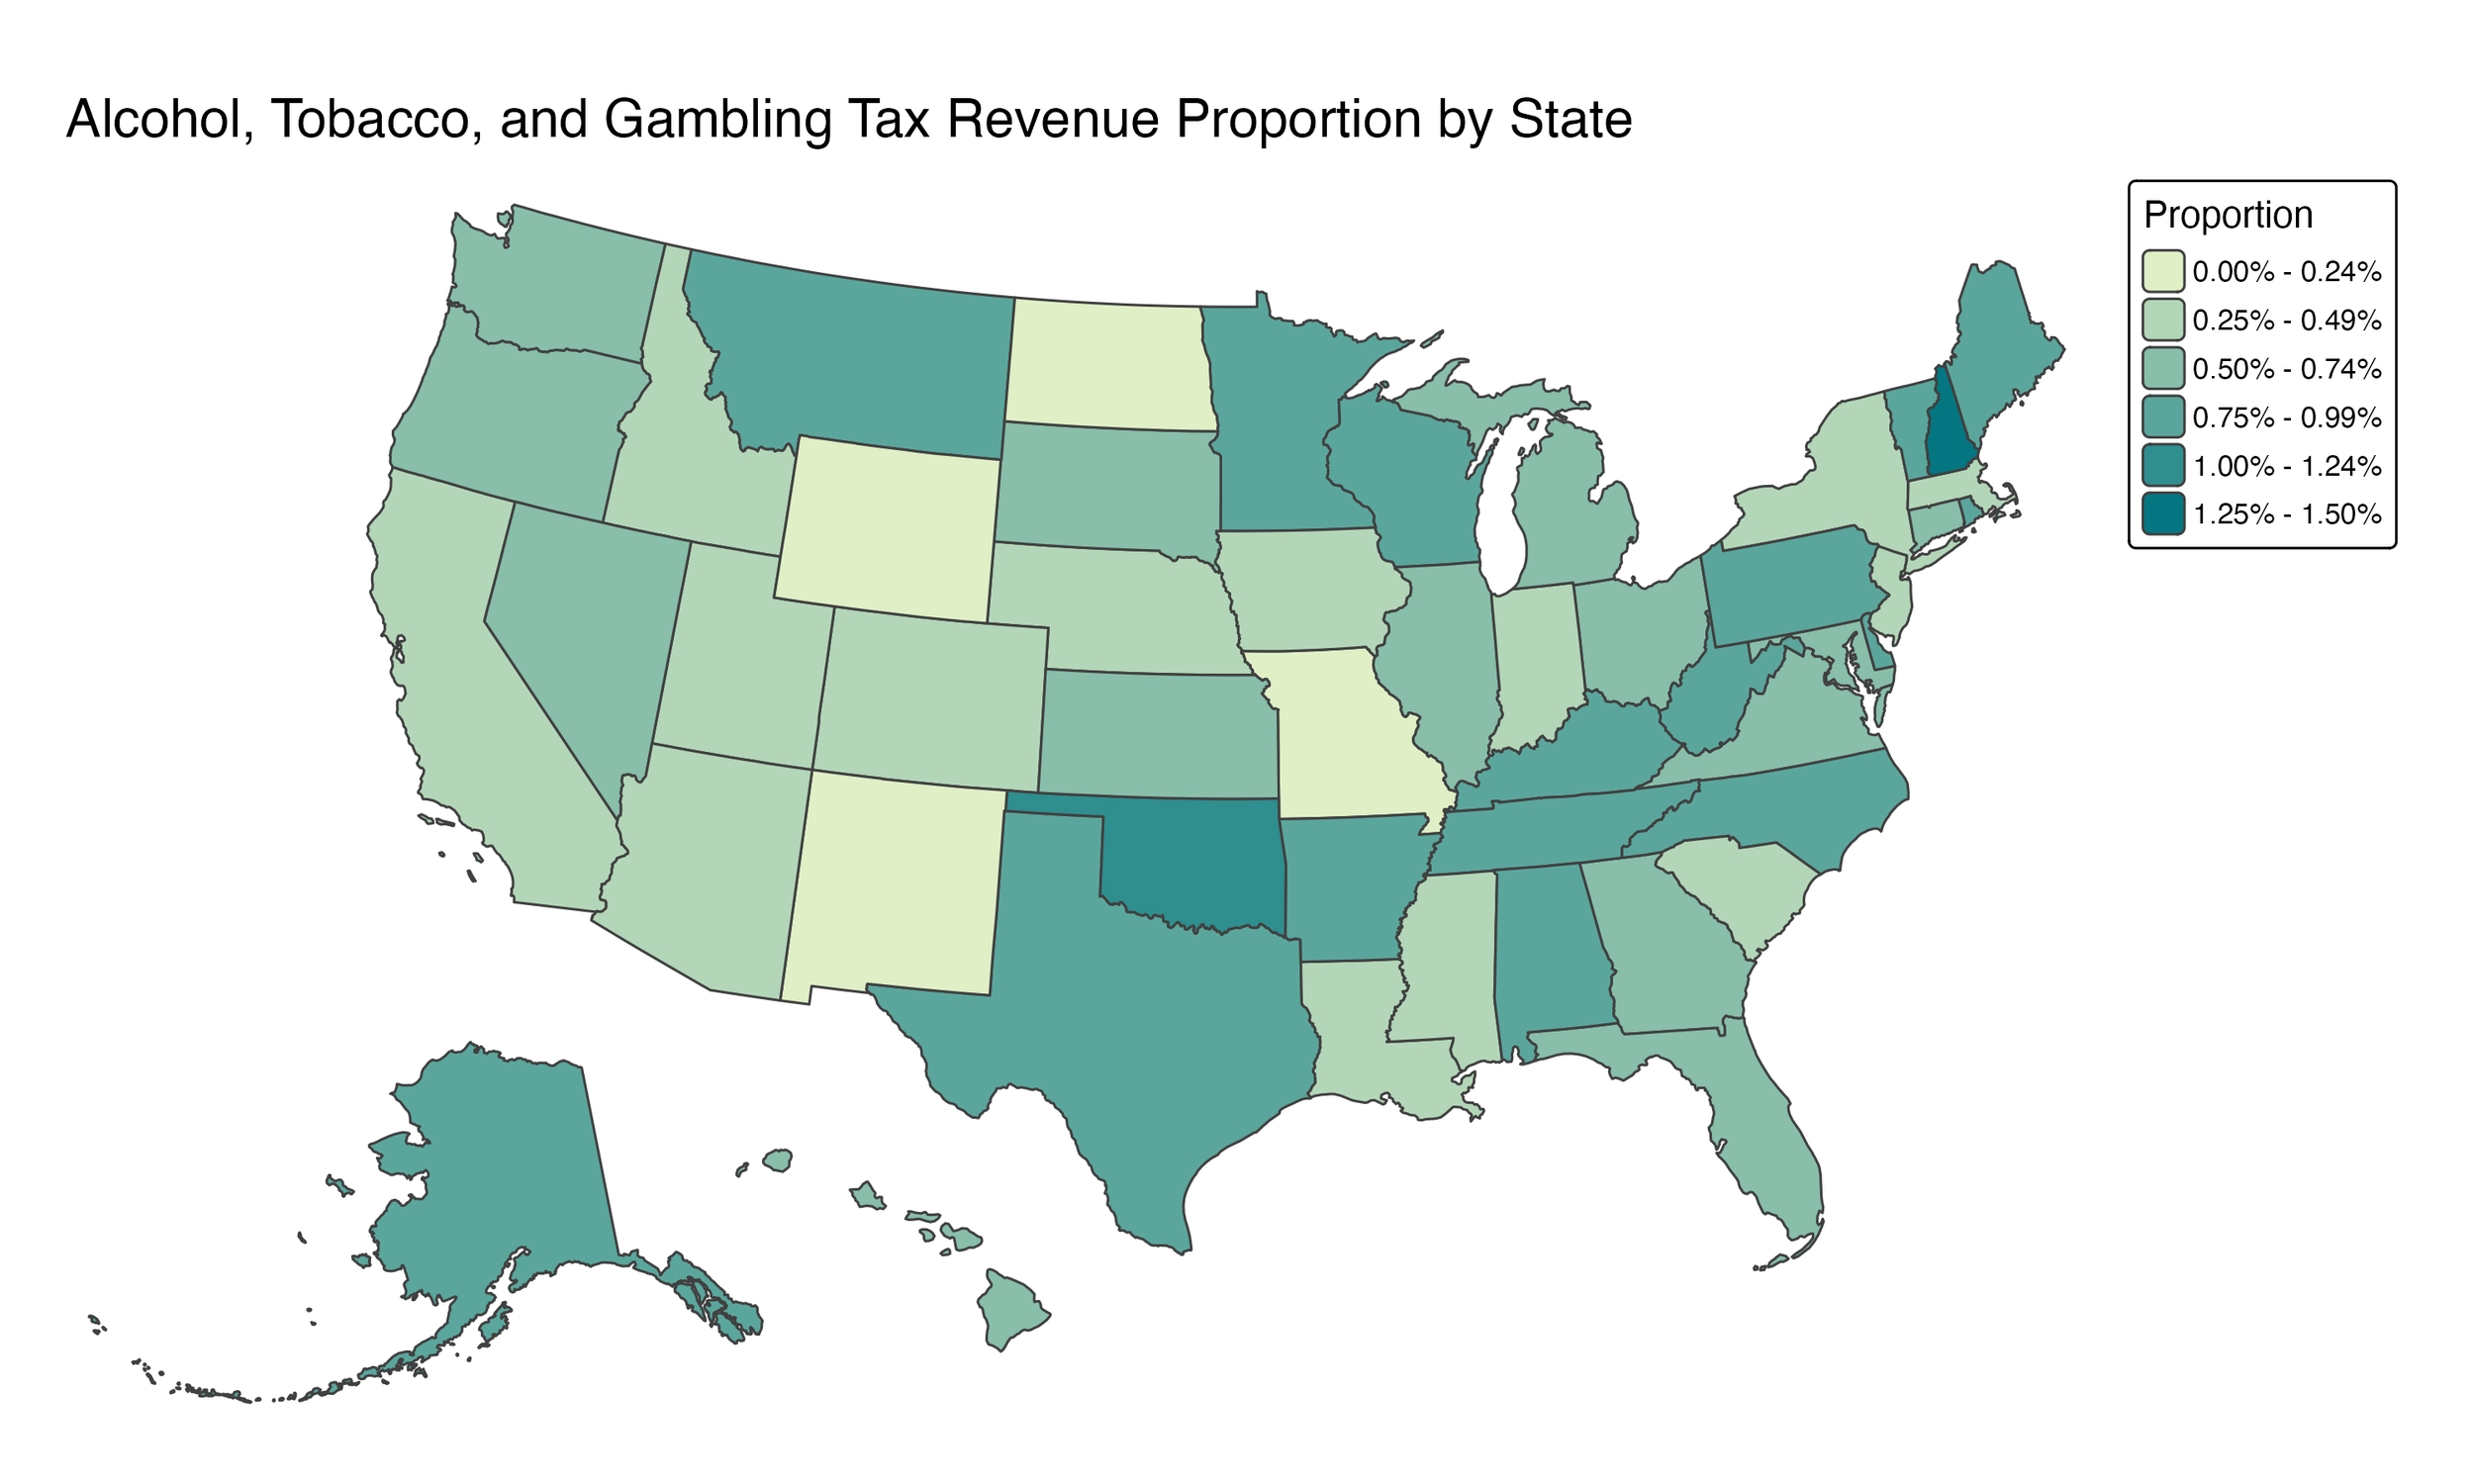
The proportion of state tax revenue generated from these taxes ranges from 0.07% (District of Columbia) to 1.48% (New Hampshire). The states with the highest percentage of tax revenue generated by these taxes are New Hampshire, Oklahoma, Tennessee, Alaska, and Rhode Island, while Ohio ranks 25th. Why do these states rely the most on alcohol, tobacco, and gambling taxes?
New Hampshire: #1 state for sin taxes
About $230 million in state tax dollars are generated by alcohol, tobacco, and gambling taxes in New Hampshire annually, which accounts for 1.48% of total state tax revenue. According to the New Hampshire Business Review, taxes on gambling and betting are the biggest contributors to this revenue in New Hampshire, and in fiscal year 2024, tax revenue from gambling and betting was higher than projected, while tax revenue from alcohol and tobacco was lower than projected.
Gambling and betting has always been common in New Hampshire, but its popularity has especially taken off in recent years. Within the past few years, several new casinos have opened up in New Hampshire, charitable gaming has grown more popular, and the state lottery system has been expanded.
Additionally, over the past few years, New Hampshire has consistently had the highest per capita alcohol consumption across the entire country, suggesting that tax revenue from alcohol is relatively higher in New Hampshire than other states.
New Hampshire is also one of two states in the country that do not collect a state income tax or sales tax. Because of this, the state is more likely to rely on other sources of tax revenue, such as alcohol, tobacco, and gambling taxes, to contribute to its state tax revenue.
Oklahoma
Oklahoma generates about $590 million in alcohol, tobacco, and gambling tax revenue per year, or about 1.11% of total state tax revenue. Oklahoma’s reliance on these taxes is likely driven by the large prevalence of gambling and the relatively low individual tax burden. Oklahoma ranks second in the United States in number of casinos, only ranking behind Nevada. Oklahoma has 142 casinos, while Nevada has 231 casinos, and the state with the third largest number of casinos, California, has just 83.
Oklahoma also has the ninth lowest individual tax burden in the United States, suggesting that a relatively higher proportion of tax revenue would be generated from alcohol, tobacco, and gambling taxes than income or sales taxes. Oklahoma legislators have recently suggested increasing cigarette taxes even more, which could lead to Oklahoma relying more heavily on these taxes moving forward.
Tennessee
Tennessee generates about $810 million in alcohol, tobacco, and gambling tax revenue annually, which accounts for around 1% of total state tax revenue. Tennessee’s high reliance on these taxes could be explained by a couple of reasons.
Tennessee is one of nine states that does not collect income taxes, meaning that they must collect more taxes in other areas. In 2020, Tennessee ranked second in alcohol tax revenue per capita, and in 2022, the state ranked third in adult cigarette smoking rates.
Alaska
About $160 million in state tax dollars are generated by alcohol, tobacco, and gambling taxes per year in Alaska, accounting for about 0.98% of total state tax revenue. Alongside New Hampshire, Alaska is the only other state in the country that does not have a statewide income tax or general sales tax, meaning that they must rely more heavily on other forms of taxation for state tax revenue.
Alaska has the highest per capita alcohol tax revenue out of all fifty states, and they rank tenth in alcohol consumption per capita, suggesting that a large portion of tax revenue in Alaska comes from alcohol sales.
Rhode Island
Rhode Island collects about $155 million in tax dollars from alcohol, tobacco, and gambling taxes per year, accounting for about 0.95% of total state tax revenue. With a cigarette tax rate of $4.50 per pack, Rhode Island is tied with Washington D.C. for the third highest cigarette tax rate in the country. Rhode Island’s cigarette tax rate is about $2.50 above the national average, and legislators have recently suggested increasing the cigarette tax rate in Rhode Island even more.
The future of sin taxes
While many states and localities rely on alcohol, tobacco, and gambling taxes for financing public services, alcohol consumption is on the decline nationally and tobacco use has been declining for decades. While sports gambling has risen dramatically in the past decade, this trend is unlikely to continue indefinitely into the future. As Pigou originally theorized a century ago, these sorts of taxes are better tools for curbing behavior than creating sustainable revenue streams.