
If you go to data.census.gov, you can find the number of people in poverty in your state, county, city, or even zip code. Scrolling through, you can see breakdowns of who is in poverty by race, gender, household size, and a number of other characteristics.

In 2026, the federal poverty line is $33,000 for a family of four. Does this sound reasonable to you? There are certainly people who want to make this number lower, higher, or different. But the determination of the federal poverty threshold is a bureaucratic process that is in the hands of analysts every single year.
Who sets the federal poverty line?
While the United States Census Bureau in the United States Department of Commerce is the federal agency we most associate poverty measurement with, it is the United States Department of Health and Human Services that is in charge of issuing the federal poverty guidelines. These guidelines include the thresholds for a number of household sizes and include formulas for determining poverty status for very large families as well.
The Department of Health and Human Services has been in charge of issuing poverty guidelines since 1981, when Congress tasked the Secretary of the Department with issuing them every year. Prior to 1981, the guidelines were issued by the Community Services Administration, an independent agency that was folded into the Department of Health and Human Services in 1981 under the first budget of the Reagan administration.
According to the Department of Health and Human Services, the calculation is quite simple: analysts take the previous year’s poverty thresholds then adjust them for inflation, using the Consumer Price Index for All Urban Consumers as their inflation metric.
But where did the federal poverty line originate?
Where the federal poverty line came from
In 1964, President Lyndon B. Johnson launched his War on Poverty with the goal of “total victory” over poverty in the United States. To wage war against poverty, Johnson needed a metric to estimate the impact policies were having on poverty. This necessitated an official poverty measure.
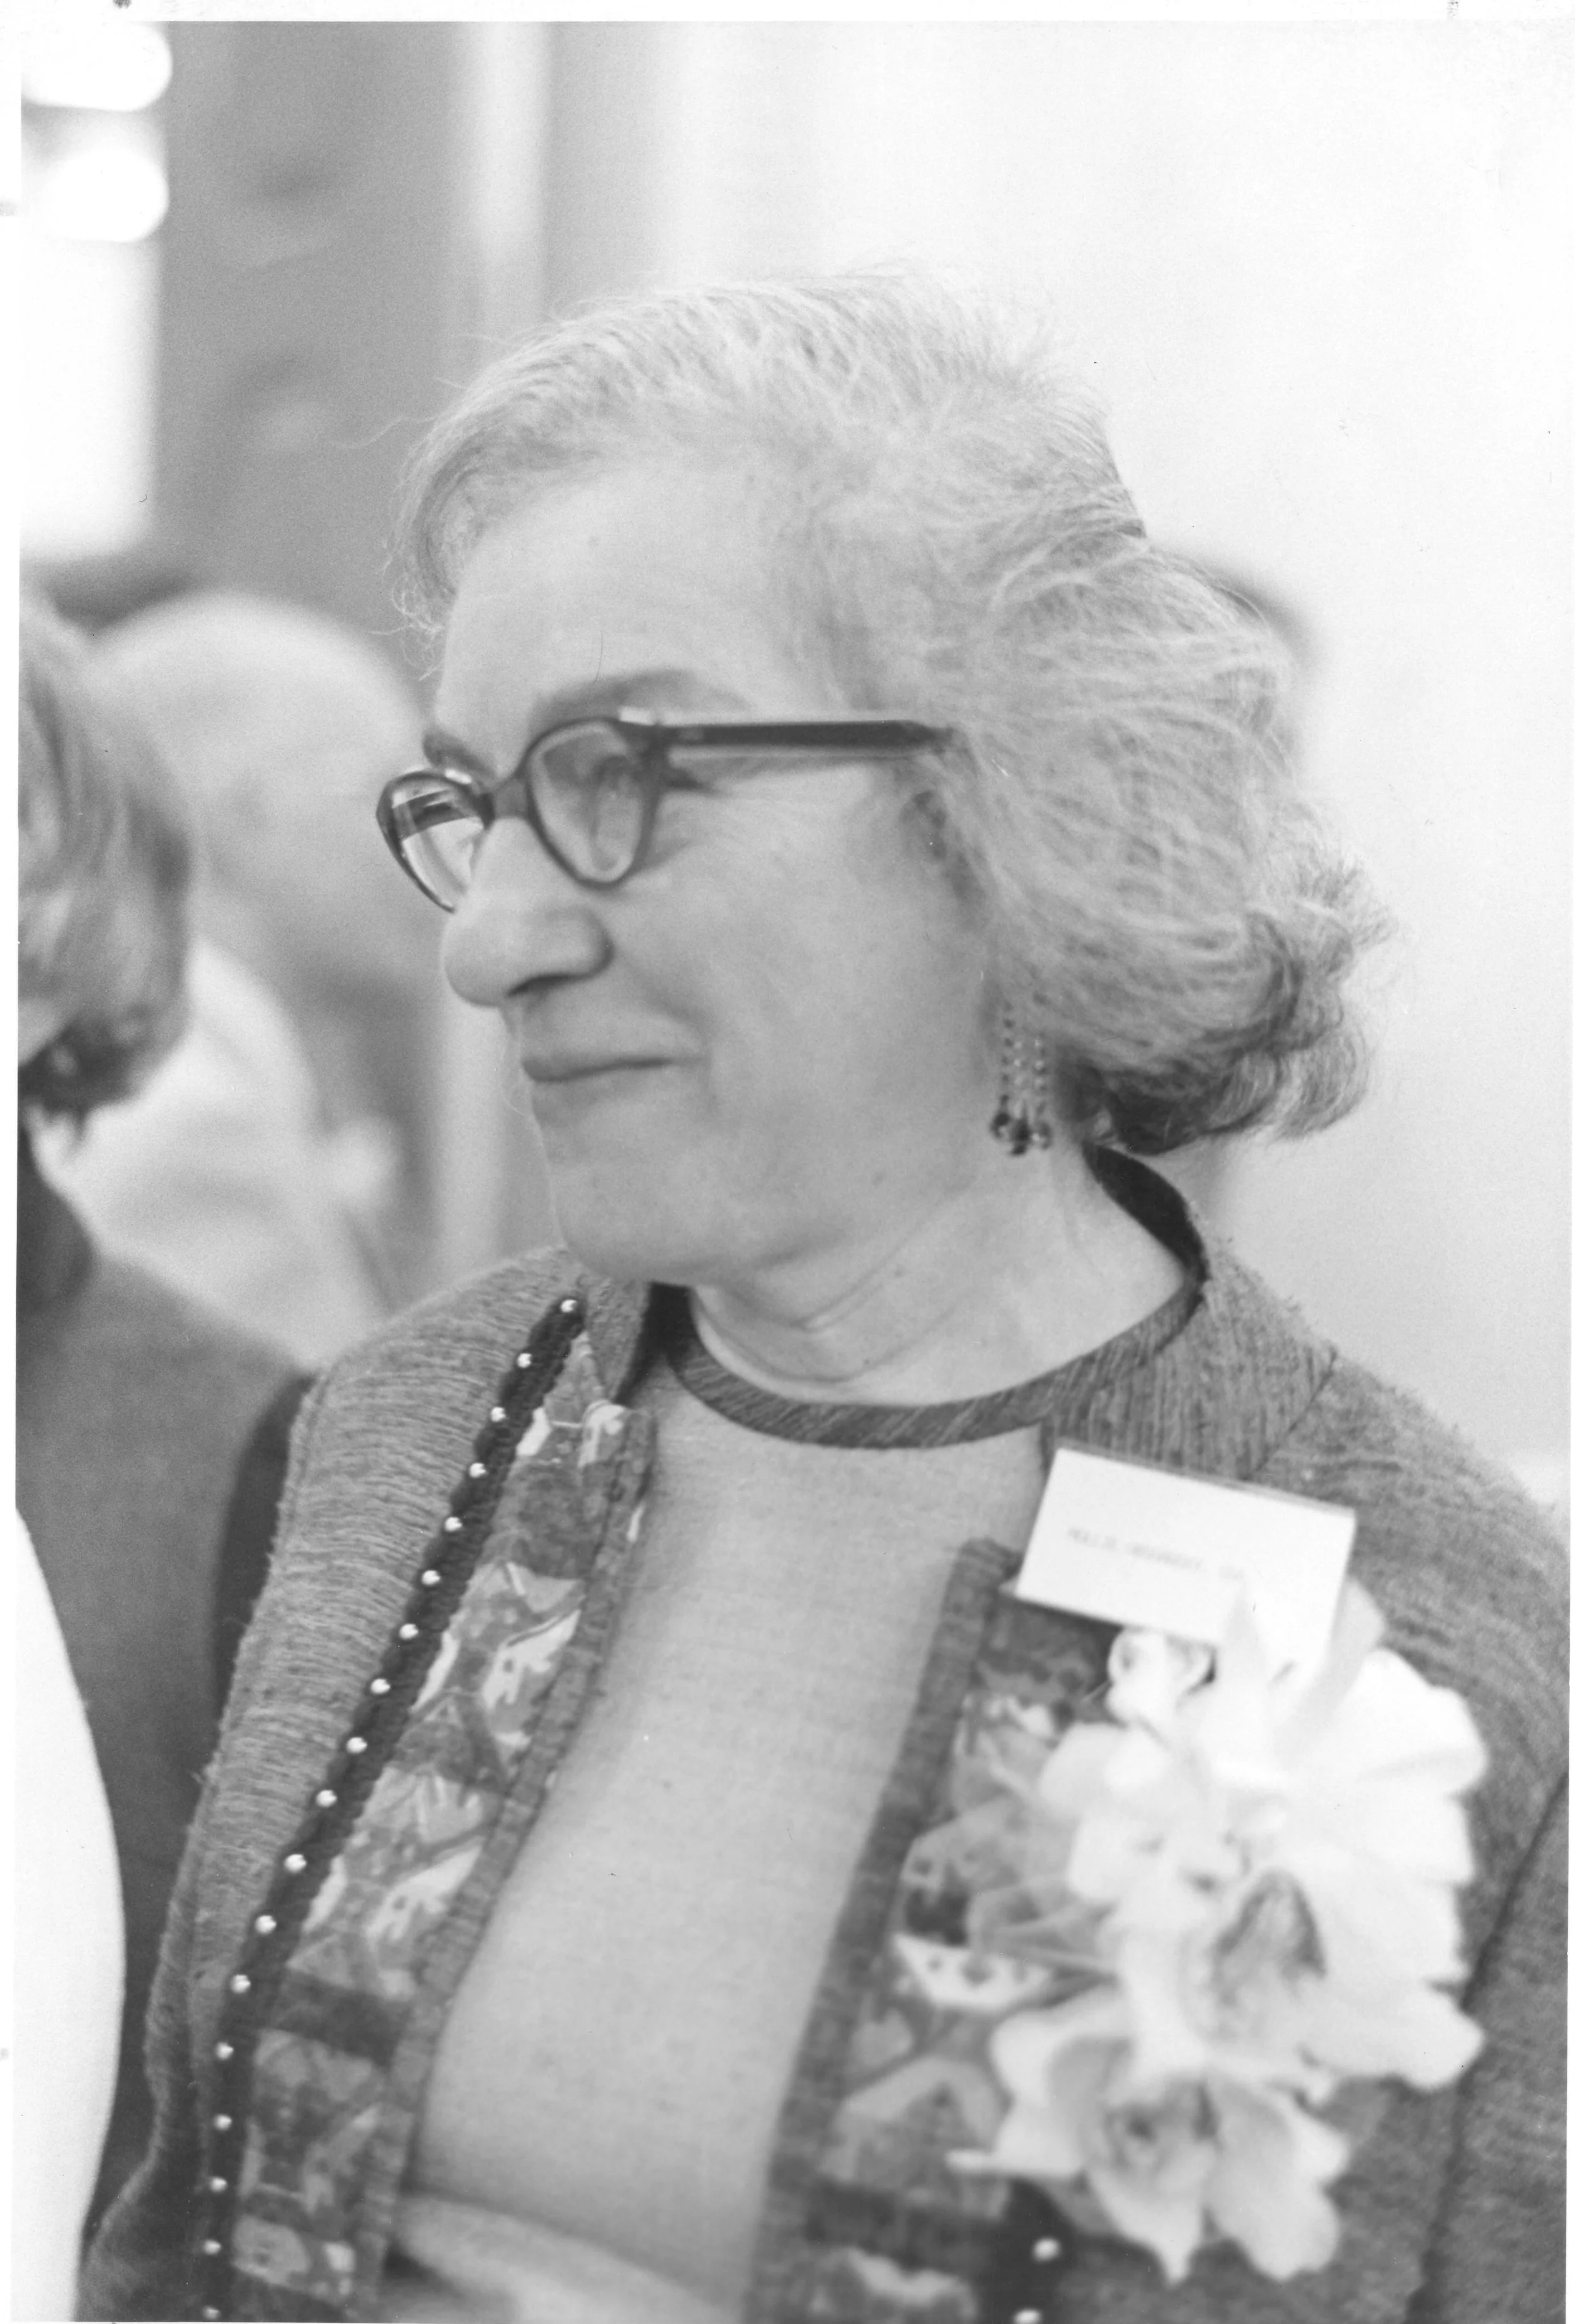
Social Security Administration Economist Mollie Orshansky had been working on a threshold for poverty since 1963. By 1965, the Office for Economic Opportunity (which later became the Community Services Administration) adopted Orshansky’s measure.
Orshansky’s model was simple. At the time of the Great Society War on Poverty, the average American household spent one third of their income on food. Orshansky then wagered that three times the cost of a “thrifty food plan” would constitute poverty income.
This measure has changed very little over the six decades since its adoption. In the early days of the measure, Orshansky updated the measure annually to adjust for the cost of food. In 1969, the updates were simplified to be tied to the Consumer Price Index instead. Early measures of the official poverty threshold estimated different income needs for male- and female-headed households and farm- and non-farm households. These were all eliminated in a 1981 reorganization of the measure. Subsequent changes to the calculation of the Consumer Price Index have changed the trajectory of the measure over time. But at its core, the official poverty measure has barely changed since it was first introduced in 1965.
Problems with the federal poverty line
The world has changed over the past six decades. The core conceit of Orshansky’s original official poverty measure was that multiplying a thrifty food plan by three would give a reasonable estimate for the income needed to survive in the United States.
Over the past six decades, though, the cost of food has plummeted compared to the cost of other goods. The average family spends about an eighth of their income on food now. Other costs have risen: medical expenses have increased from 7% of GDP in 1970 to 18% of GDP in 2024. Housing prices have doubled the pace of overall inflation since the 1960s.
Changes in housing prices have led to significant divergences in cost of living across the country. While a nationwide poverty measure may have been reasonably accurate in the 1960s, there are now vast differences in the cost of living across states. Because of these changes, the assumption that escaping poverty takes the same amount of income in California as it does in West Virginia is now much weaker.
Income sources have also changed dramatically since the War on Poverty. The Official Poverty Measure was an excellent tool for measuring poverty when incomes were largely just wages and social security. The institution of large safety net programs like the Supplemental Nutrition Assistance Program (formerly “food stamps”), the Earned Income Tax Credit, free school lunches and the Child Tax Credit have led to much of income for lower-income people coming from places other than wages and social security.
Alternatives to the official poverty measure
In 1995, the National Research Council convened a consensus group to recommend updates to the federal poverty guidelines. This project culminated in the release of a consensus report that recommended changes to the federal poverty calculation: tying it to a broader range of goods than just food, adjusting for cost of living in different parts of the country, including income from new safety net measures in the calculation of income resources. This report sat on a shelf for over a decade until New York City became the first place to put the measure into action, calculating its New York Poverty Measure using the new methodology. The Census Bureau followed suit the following year, calculating the first Supplemental Poverty Measure, which is now released every year alongside the Official Poverty Measure numbers. States like California, Wisconsin, and Ohio have their state versions of these.
The Supplemental Poverty Measure made major headlines in 2022 when the Census Bureau reported on the record reduction in poverty made by the 2021 expansion of the federal child tax credit. Because the Supplemental Poverty Measure included the child tax credit in its income calculation, it was able to do something the official poverty measure could not: show the impact of public programs on poverty.
Another rival to the Official Poverty Measure is “relative poverty,” which is usually defined as having less than half of the median income. This is a popular measurement for poverty in the Organisation for Economic Co-operation and Development since it gives a good benchmark for poverty across countries. It’s also easier to calculate and a little bit of a different take on the suspect “subsistence needs” approach to poverty that the Official Poverty Measure takes.
To this day, the Supplemental Poverty Measure is the most widely accepted measure among poverty researchers, but it is still supplemental. Since the Supplemental Poverty Measure shows higher poverty rates in coastal areas and lower poverty rates in the middle of the country than the Official Poverty Measure, adopting it as a guidance for issuing federal benefits would lead to a redistribution of resources that would be politically difficult to say the least. For the time being, Molly Orshansky’s Official Poverty Measure will continue to be the measure of poverty in America, with little change from its inception in 1965.


