
The sugar that makes our foods so sweet might just be turning our lives sour.

Obesity is currently one of the largest public health problems in the United States, with the CDC estimating that as many as 40.3% of Americans were obese in 2024. If current trends continue, experts estimate that as much as two thirds of Americans may be obese by 2050. One of the largest contributors to this phenomenon is the relatively high amount of sugar in our diets, with the average American consuming more than 100 pounds of sugar in a given year. While sugar is one of the basic necessities for cell energy, too much of it leads to storage, resulting in lethargy and weight gain. The question remains however, where is all this sugar coming from?
According to an analysis of NHANES data from 2003–2016, about 39% of added sugars in the American diet come from Sugar-Sweetened Beverages. Broadly, a sugar-sweetened beverage is just a drink with added caloric-sweeteners, with the term mainly referring to drinks like soda, energy drinks, and non-100% fruit juice. These drinks tend to pack quite the sugary punch, with experts estimating that the average sugar-sweetened beverage contains around 35–37.5 grams of sugar per 12 oz. To put this into perspective, under American Heart Association guidelines, this means just one 12 oz. can packs nearly 105% of daily recommended sugar intake for men and 150% for women. Think about that next time you reach for a bottle of ice-cold Coke! Additionally, these beverages can not only wreak havoc on a person’s nutritional goals, but are also associated with a myriad negative health consequences, such as cardiovascular disease, type 2 diabetes, increased stroke likelihood, cavities, enamel erosion, and of course weight gain. Despite these negative effects, these beverages are ubiquitous and often not given a second thought, allowing these vast quantities of sugar to sneak their way into our diets.
For years, health advocates have been urging lawmakers to do something about this dietary crisis. In 2014, Berkeley California became the first state to act, enacting a 1¢/fl oz. tax on all sugar-sweetened beverages sold within the city. This translates to a 12¢ tax per 12 oz. can and a 68¢ increase for two liter bottles. The tax had a substantial impact, increasing sugar-sweetened beverage prices by over 8% on average and reducing consumption by 21% just a few months after implementation. Despite the substantial price hike, the tax was generally viewed favorably and still remains in place to this day. This led other cities, such as Philadelphia, San Francisco, Albany, and Seattle to follow suit, implementing similar taxes to the one seen in Berkley. States such as Hawaii and Massachusetts have even gone as far as to propose statewide sugary beverage taxes, although none have passed yet.
One of the most important aspects to consider when enacting these taxes is how an increase in sugary beverage prices is expected to affect the consumption of other goods. If people simply swap out their sugary beverages with candies and cookies for example, this defeats the whole point of the tax. In economics, we evaluate the effect of one good’s price change on the consumption of another through “cross-price elasticity,” which is defined as the percentage increase in one good’s quantity based on a price increase in another good. For complementary goods, meaning goods that are often purchased together, these cross-price elasticities tend to be negative, meaning that as the price of one increases, consumption of the other tends to decrease. For substitutes, meaning goods that compete with each other for our hard-earned cash, cross-price elasticity is typically positive, as higher prices for one incentivizes consumption of the other.
While cross-price elasticities are a vital tool for economic analysis, they can never truly give us the full picture on their own. In a large, interconnected market like the U.S. food market, every good has a cross-price elasticity with every other good. This results in an interconnected web of effects as the altered quantities and prices of secondary goods affect other secondary goods, leading to a perpetual cycle of cross-price effects. This can make it difficult to discern what the final quantity demanded will be once a change is enacted.
As for sugary drink taxes, we can approximate the effects of a price increase on other goods by ignoring the cross-price elasticities of secondary goods on other secondary goods, producing what is known as a “partial equilibrium model.” Using a matrix of cross-price elasticities produced from 2006 Nielsen Homescan data, I’ve done exactly that to illustrate the effects of a 1¢/fl oz. tax on sugary drinks on the consumption of related goods. In the model I’ve constructed, we assume that 79.9% of the tax is passed on to the consumer, translating to a 15% total price increase. We also assume that only regular carbonated soft drinks, sports/energy drinks, and non-100% juice drinks are subject to the tax. Note that “Equivalent Price Change” is not the expected change in price of each good, but rather the price change that would be necessary to cause this change in quantity in the event of no tax. The results of my analysis are presented in Table 1.
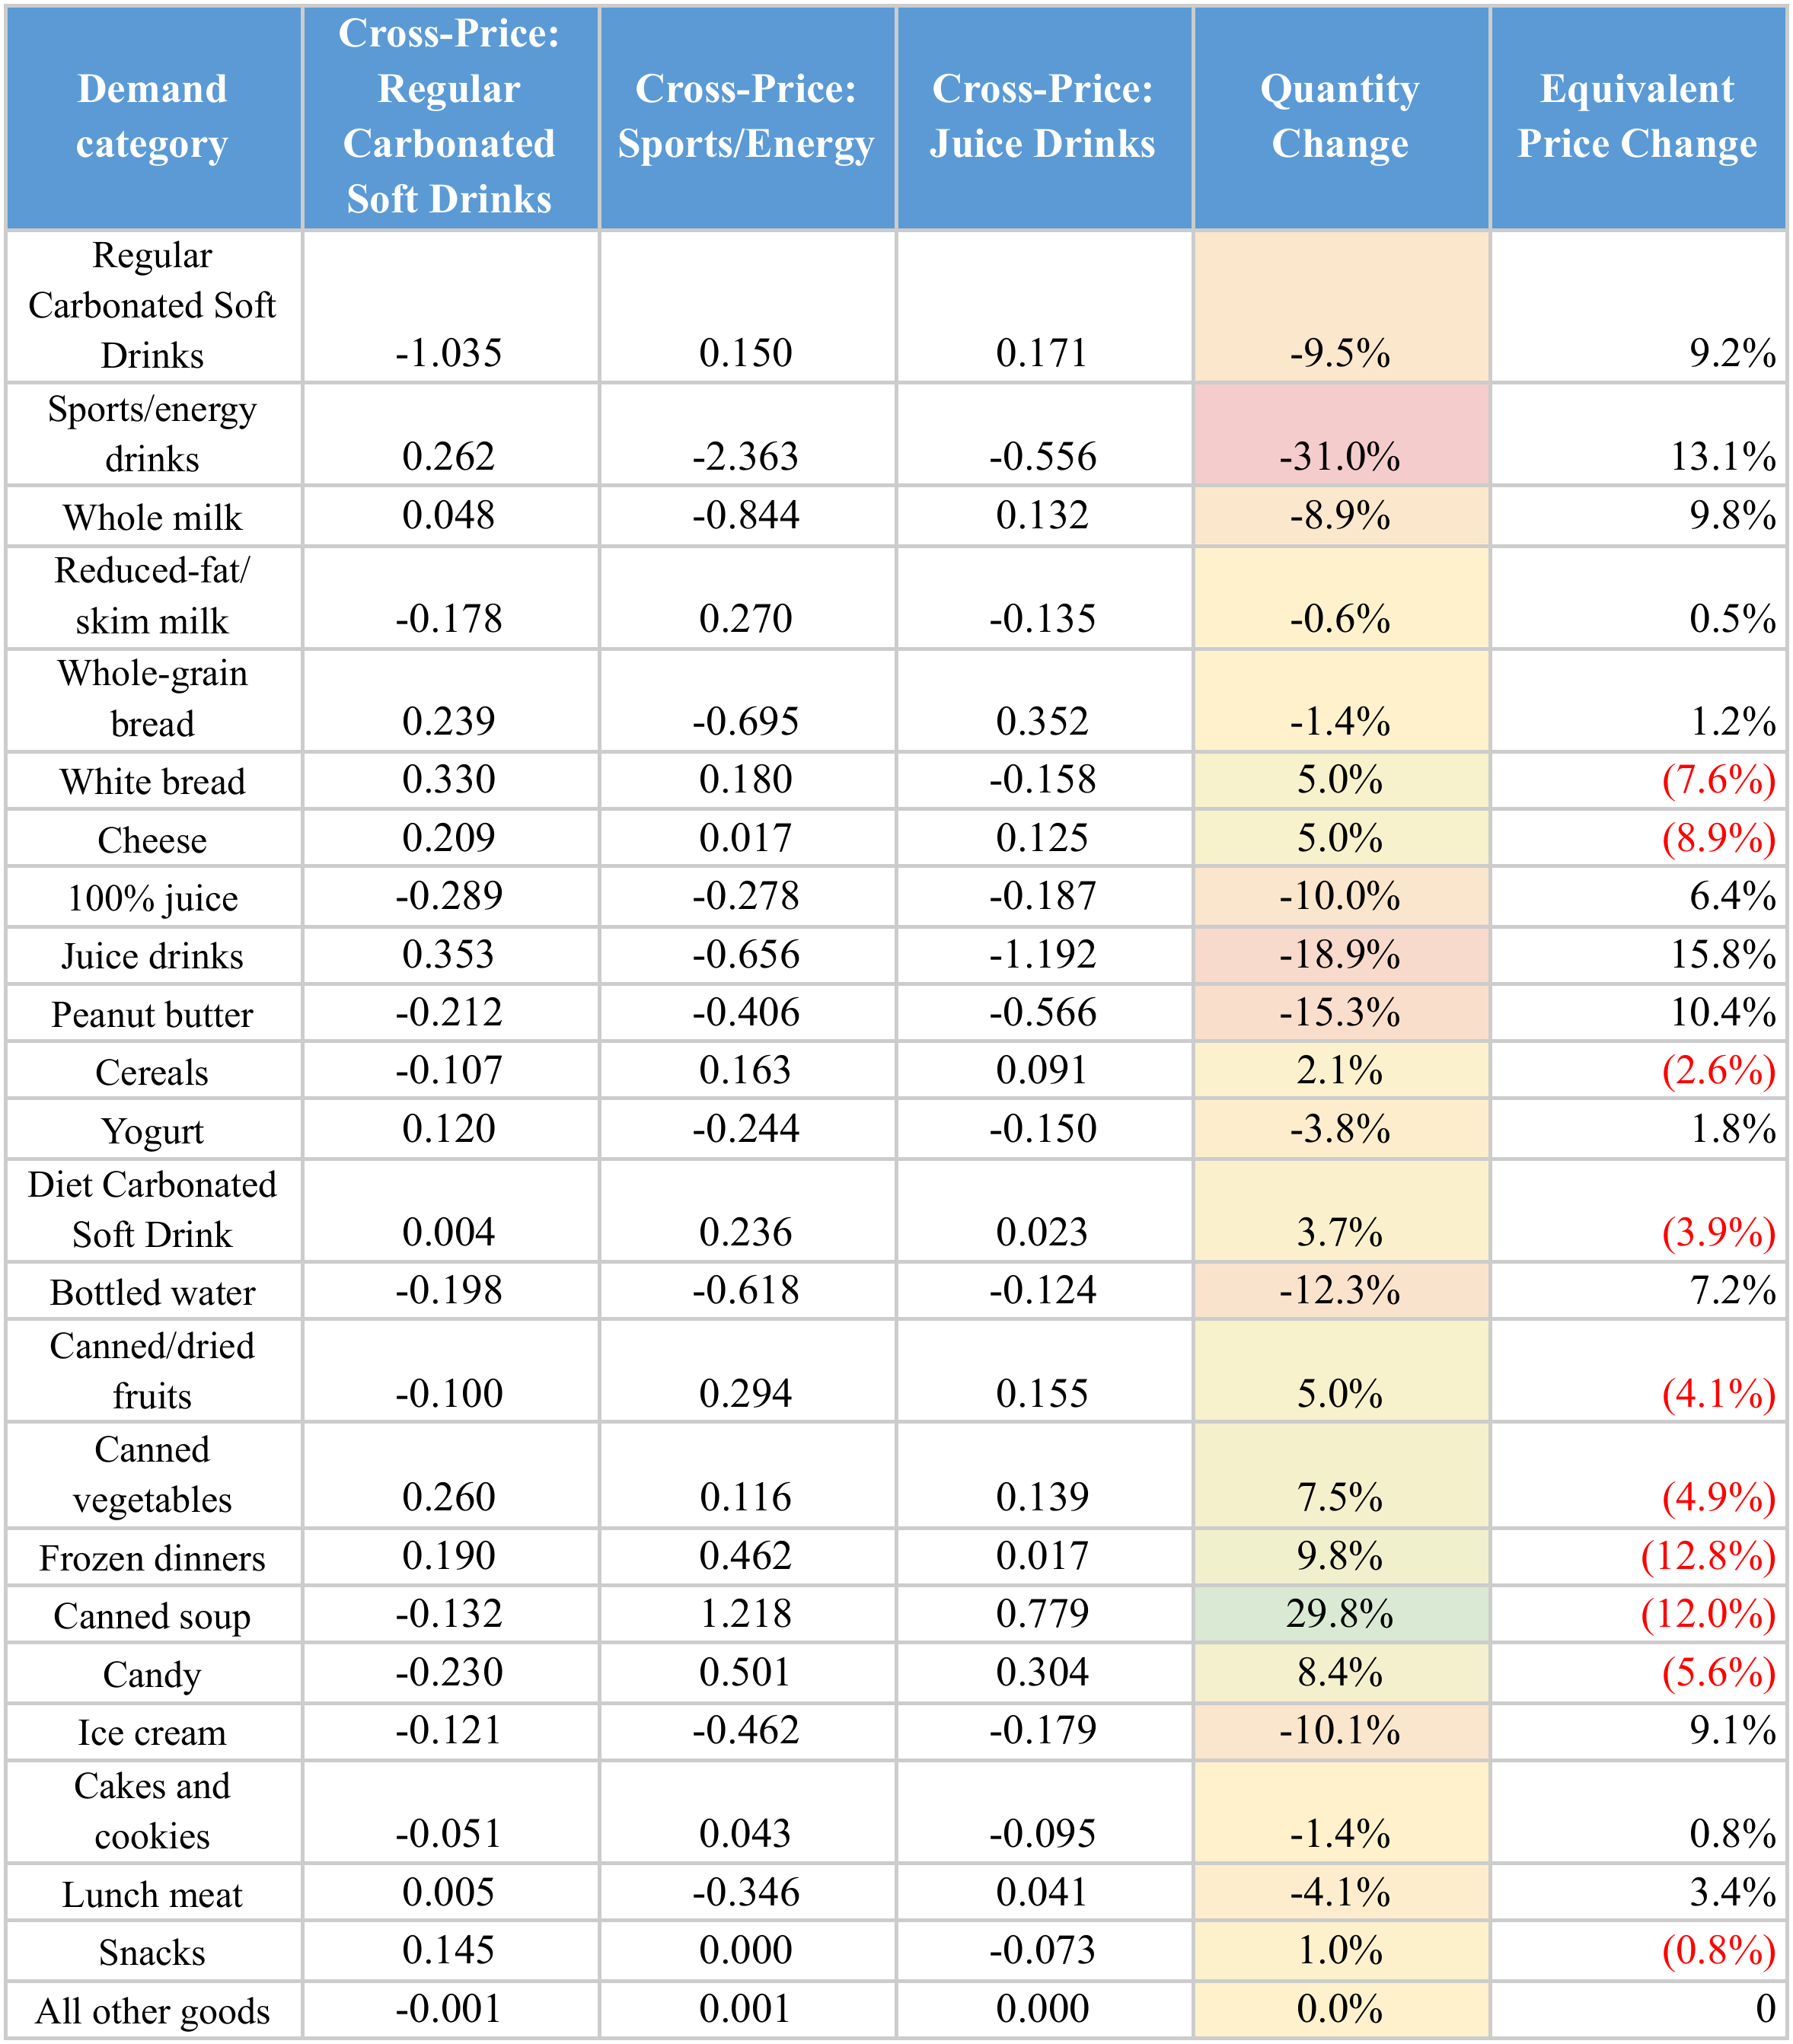

Equivalent price change is NOT expected price change, it is the amount of price change needed to produce the same quantity change if there was no tax. Cross-price elasticities provided by Zhen et al.
The effects of this analysis are striking. Despite sugar drink taxes traditionally targeting soda, the beverage that the tax impacts the most is energy drinks, due to their high own-price elasticity. This is likely caused by the high plethora of substitutes for caffeine and taurine, making consumers unwilling to pay higher prices.
Another anomaly is canned soup, which is expected to experience a nearly 30% quantity increase. This may reflect increased spending on meal-oriented items, like frozen dinners and canned vegetables, which complements soup consumption. People may not only want more soup because it is now relatively cheaper, but also because it pairs well with the new assortment of items in their carts, producing a substantial consumption increase.
Sugary goods were an interesting area of heterogeneity. Sure, candy consumption increases as the soda tax is put in place but consumption of other sources of sugar such as ice cream, cakes, and cookies decreased. This could be because candy has a closer sugar concentration to sugar-sweetened beverages, meaning that if people choose to consume candy they will likely meet their sugar craving and not feel the need to consume other sugary goods.
One would expect a soda-addict to be jumping ship to diet soda at the first sign of a price increase, but that also isn’t apparent in the model. Diet carbonated drinks only increased a modest amount compared to the substantial 15% increase in sugary drink prices. The most likely reasoning for this is simply that people are pretty particular about the taste of their beverages. This is illustrated by the story of “New Coke” in the 1980s which, despite being preferred in consumer samples, was despised for being set to replace the original formula, so much so that it was discontinued after less than three months. People like the tastes they’ve grown accustomed to, and it seems like many are unwilling to switch to something they feel is just an inferior imitation.
The decrease in bottled water consumption is another surprising result, as we would expect some consumers to switch from sugary drinks to this healthy alternative. It becomes even more interesting when we see that diet soft drinks are the only beverages in the model with increased consumption, raising the question: where is the displaced beverage consumption going? One possible explanation is that consumers who prefer flavored drinks may be less inclined to spend money on flavorless bottled water, instead turning to much cheaper tap water. Another possibility is that beverages not captured by the model, such as coffee or tea, are absorbing some of the changes in consumption.
Beverage taxes can differ substantially in what they cover. Some have even argued to extend taxes to artificially sweetened beverages, such as diet sodas and other low-calorie drinks, due to correlations found with cardiovascular disease and type 2 diabetes. I provide updated estimates in Table 2 that accounts for taxing artificial beverages at 1¢/fl oz in addition to the tax on sugar-sweetened beverages. The assumed price increase in artificial beverages is also 15%.
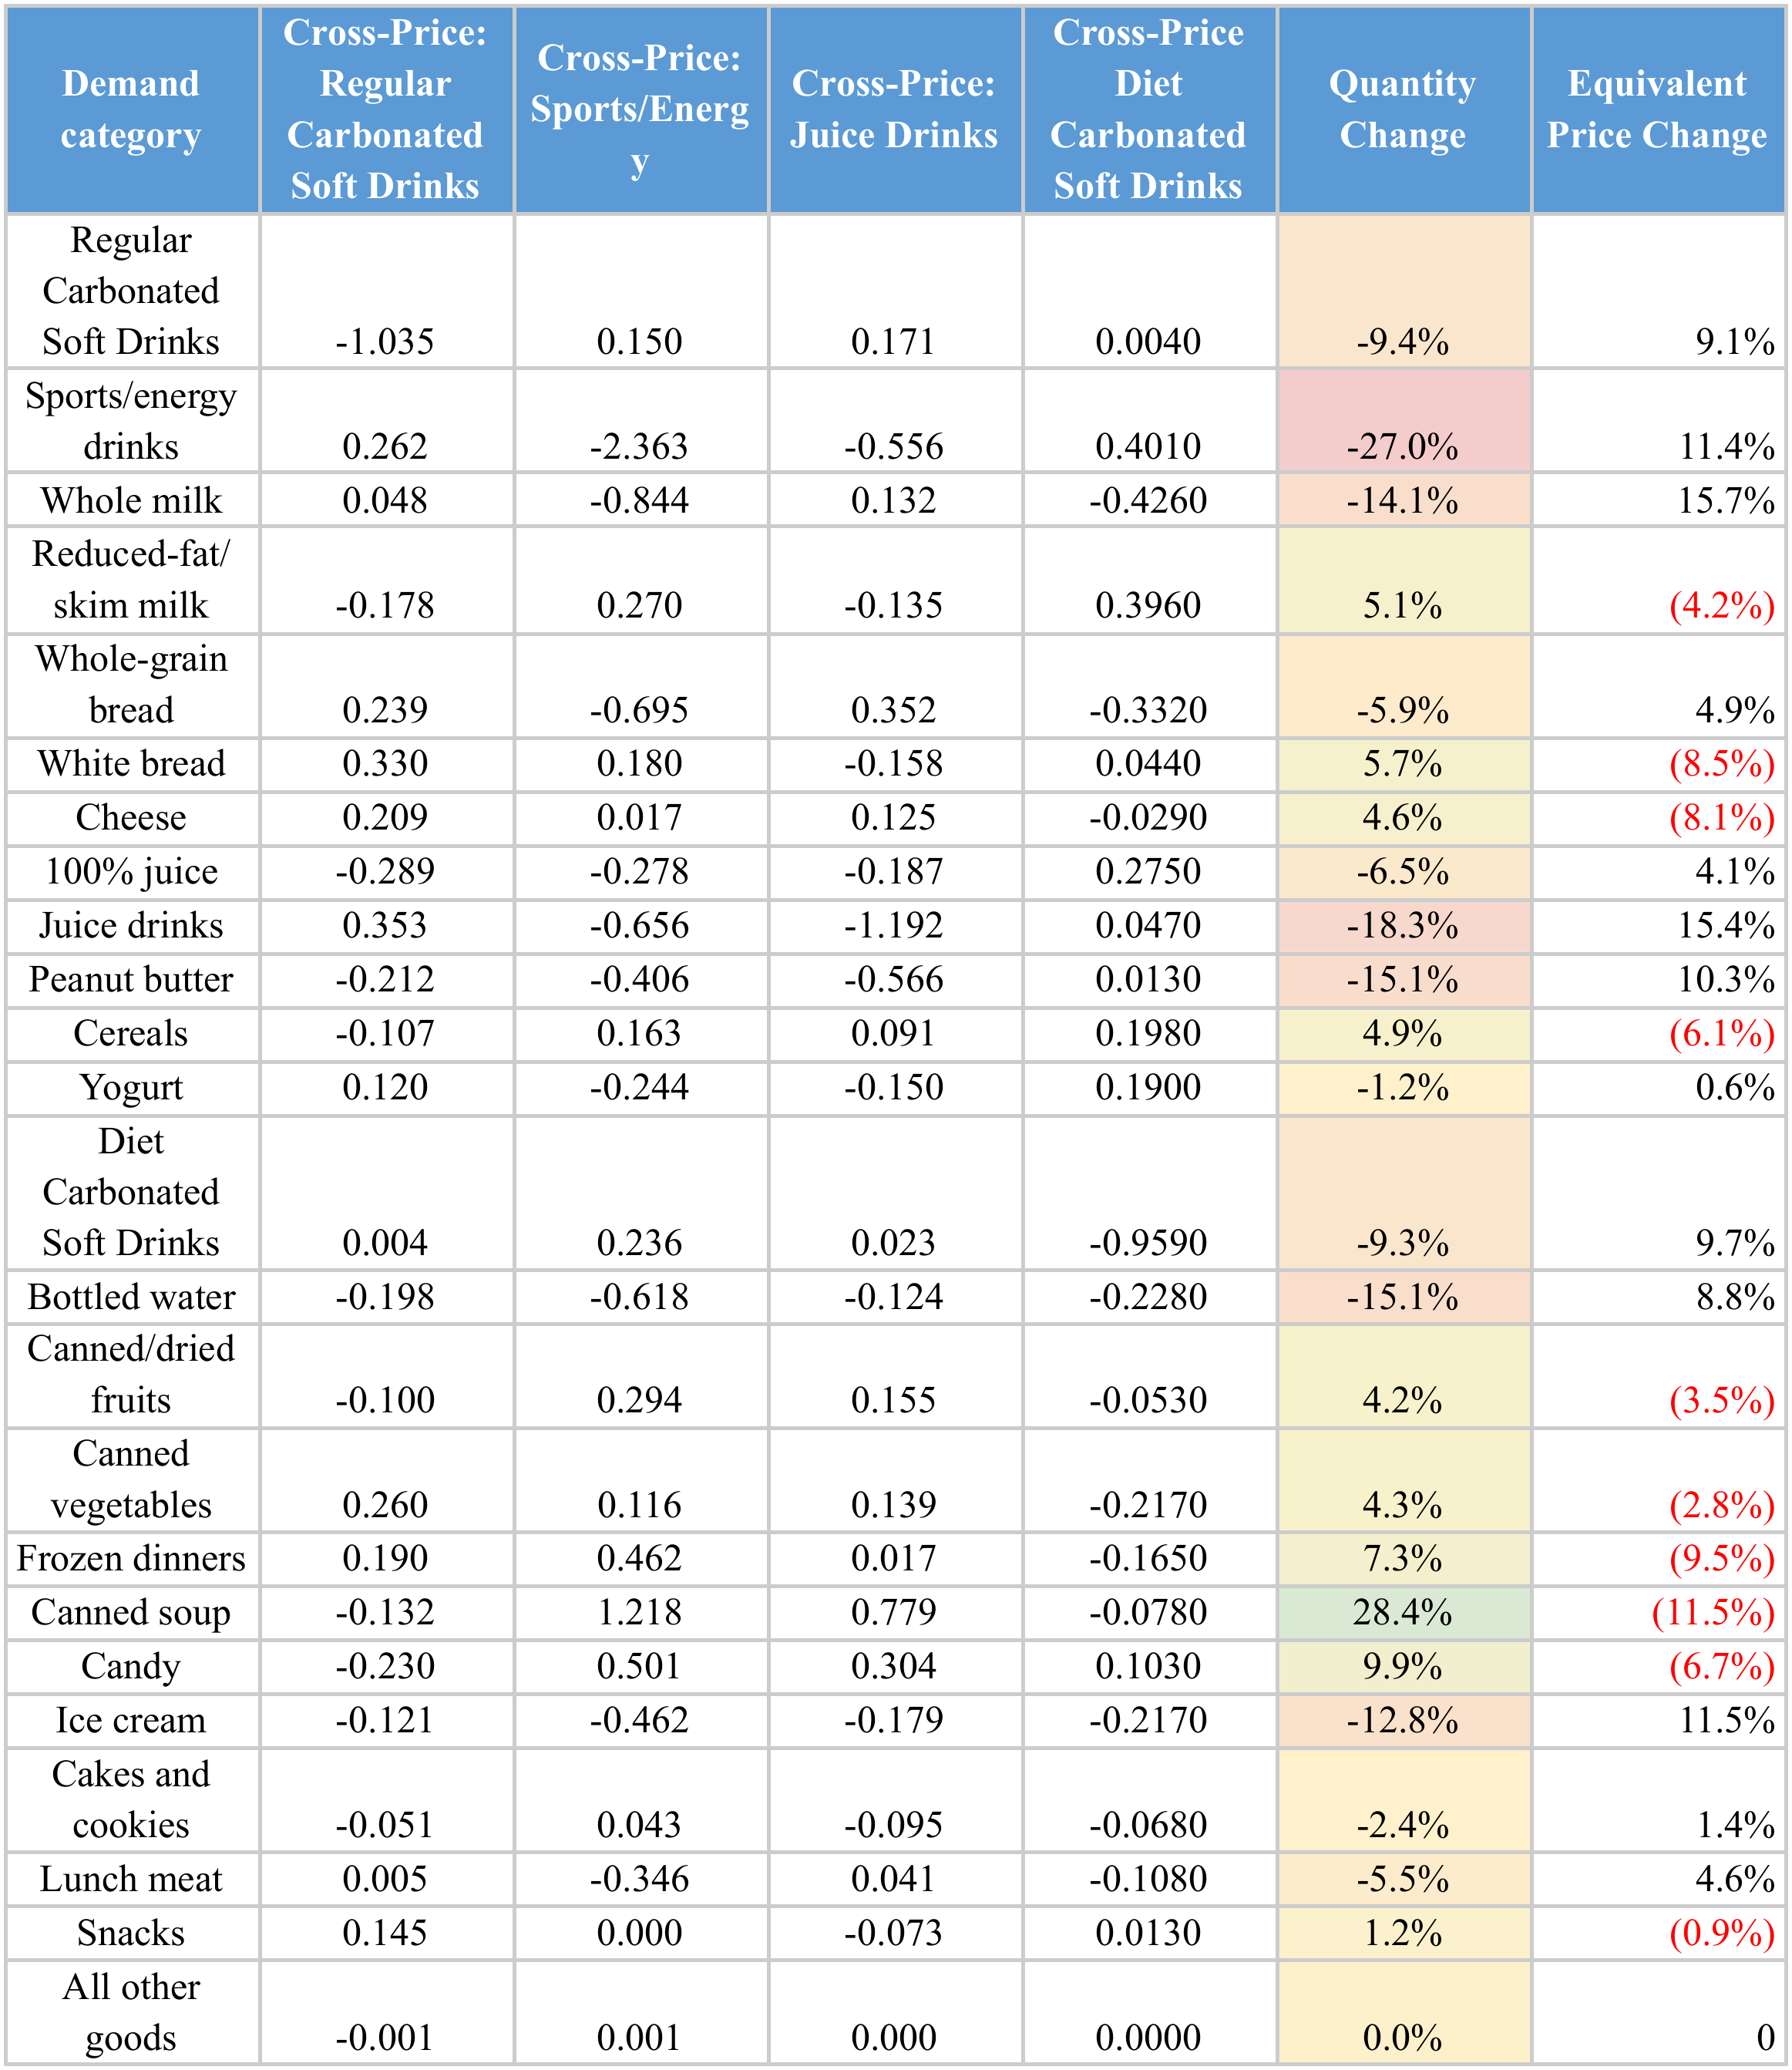
Overall, the changes in consumption are larger than in the previous tax regime, suggesting that taxing diet drinks in addition to sugary drinks produces larger behavior changes, coinciding with economic theory. Interestingly enough, we actually see higher consumption of all sugar-sweetened drink categories under this regime, suggesting that if artificial drinks are too expensive then people will just bite the bullet and continue to buy sugary drinks at higher prices. This indicates that artificially-sweetened beverage taxation may be suboptimal if the policy maker’s goal is to reduce sugar consumption.
We might all hate paying taxes, but they can be leveraged in certain scenarios to improve the public good. Obesity remains a major contributor to premature mortality in the U.S., and if something isn’t done, hundreds of thousands of Americans will remain vulnerable to its adverse health effects. Initiatives like sugary drink taxes may be a step in the right direction to prevent this dreadful future, although, we must be mindful of how our taxes affect the consumption of other goods; the last thing we want to do is push people towards even worse options!