

The American Time Use Survey is one of the most fascinating publicly-available data sets. The concept is deceptively simple: the Bureau of Labor Statistics takes a nationally representative sample of Americans and surveys them on how and with whom they spend their time. The insights we glean from them tell us so much about how America uses its most precious resource.

Just last month, the 2024 data was released. This gives us the opportunity to once again dive into this dataset and see what sort of insights we can uncover.
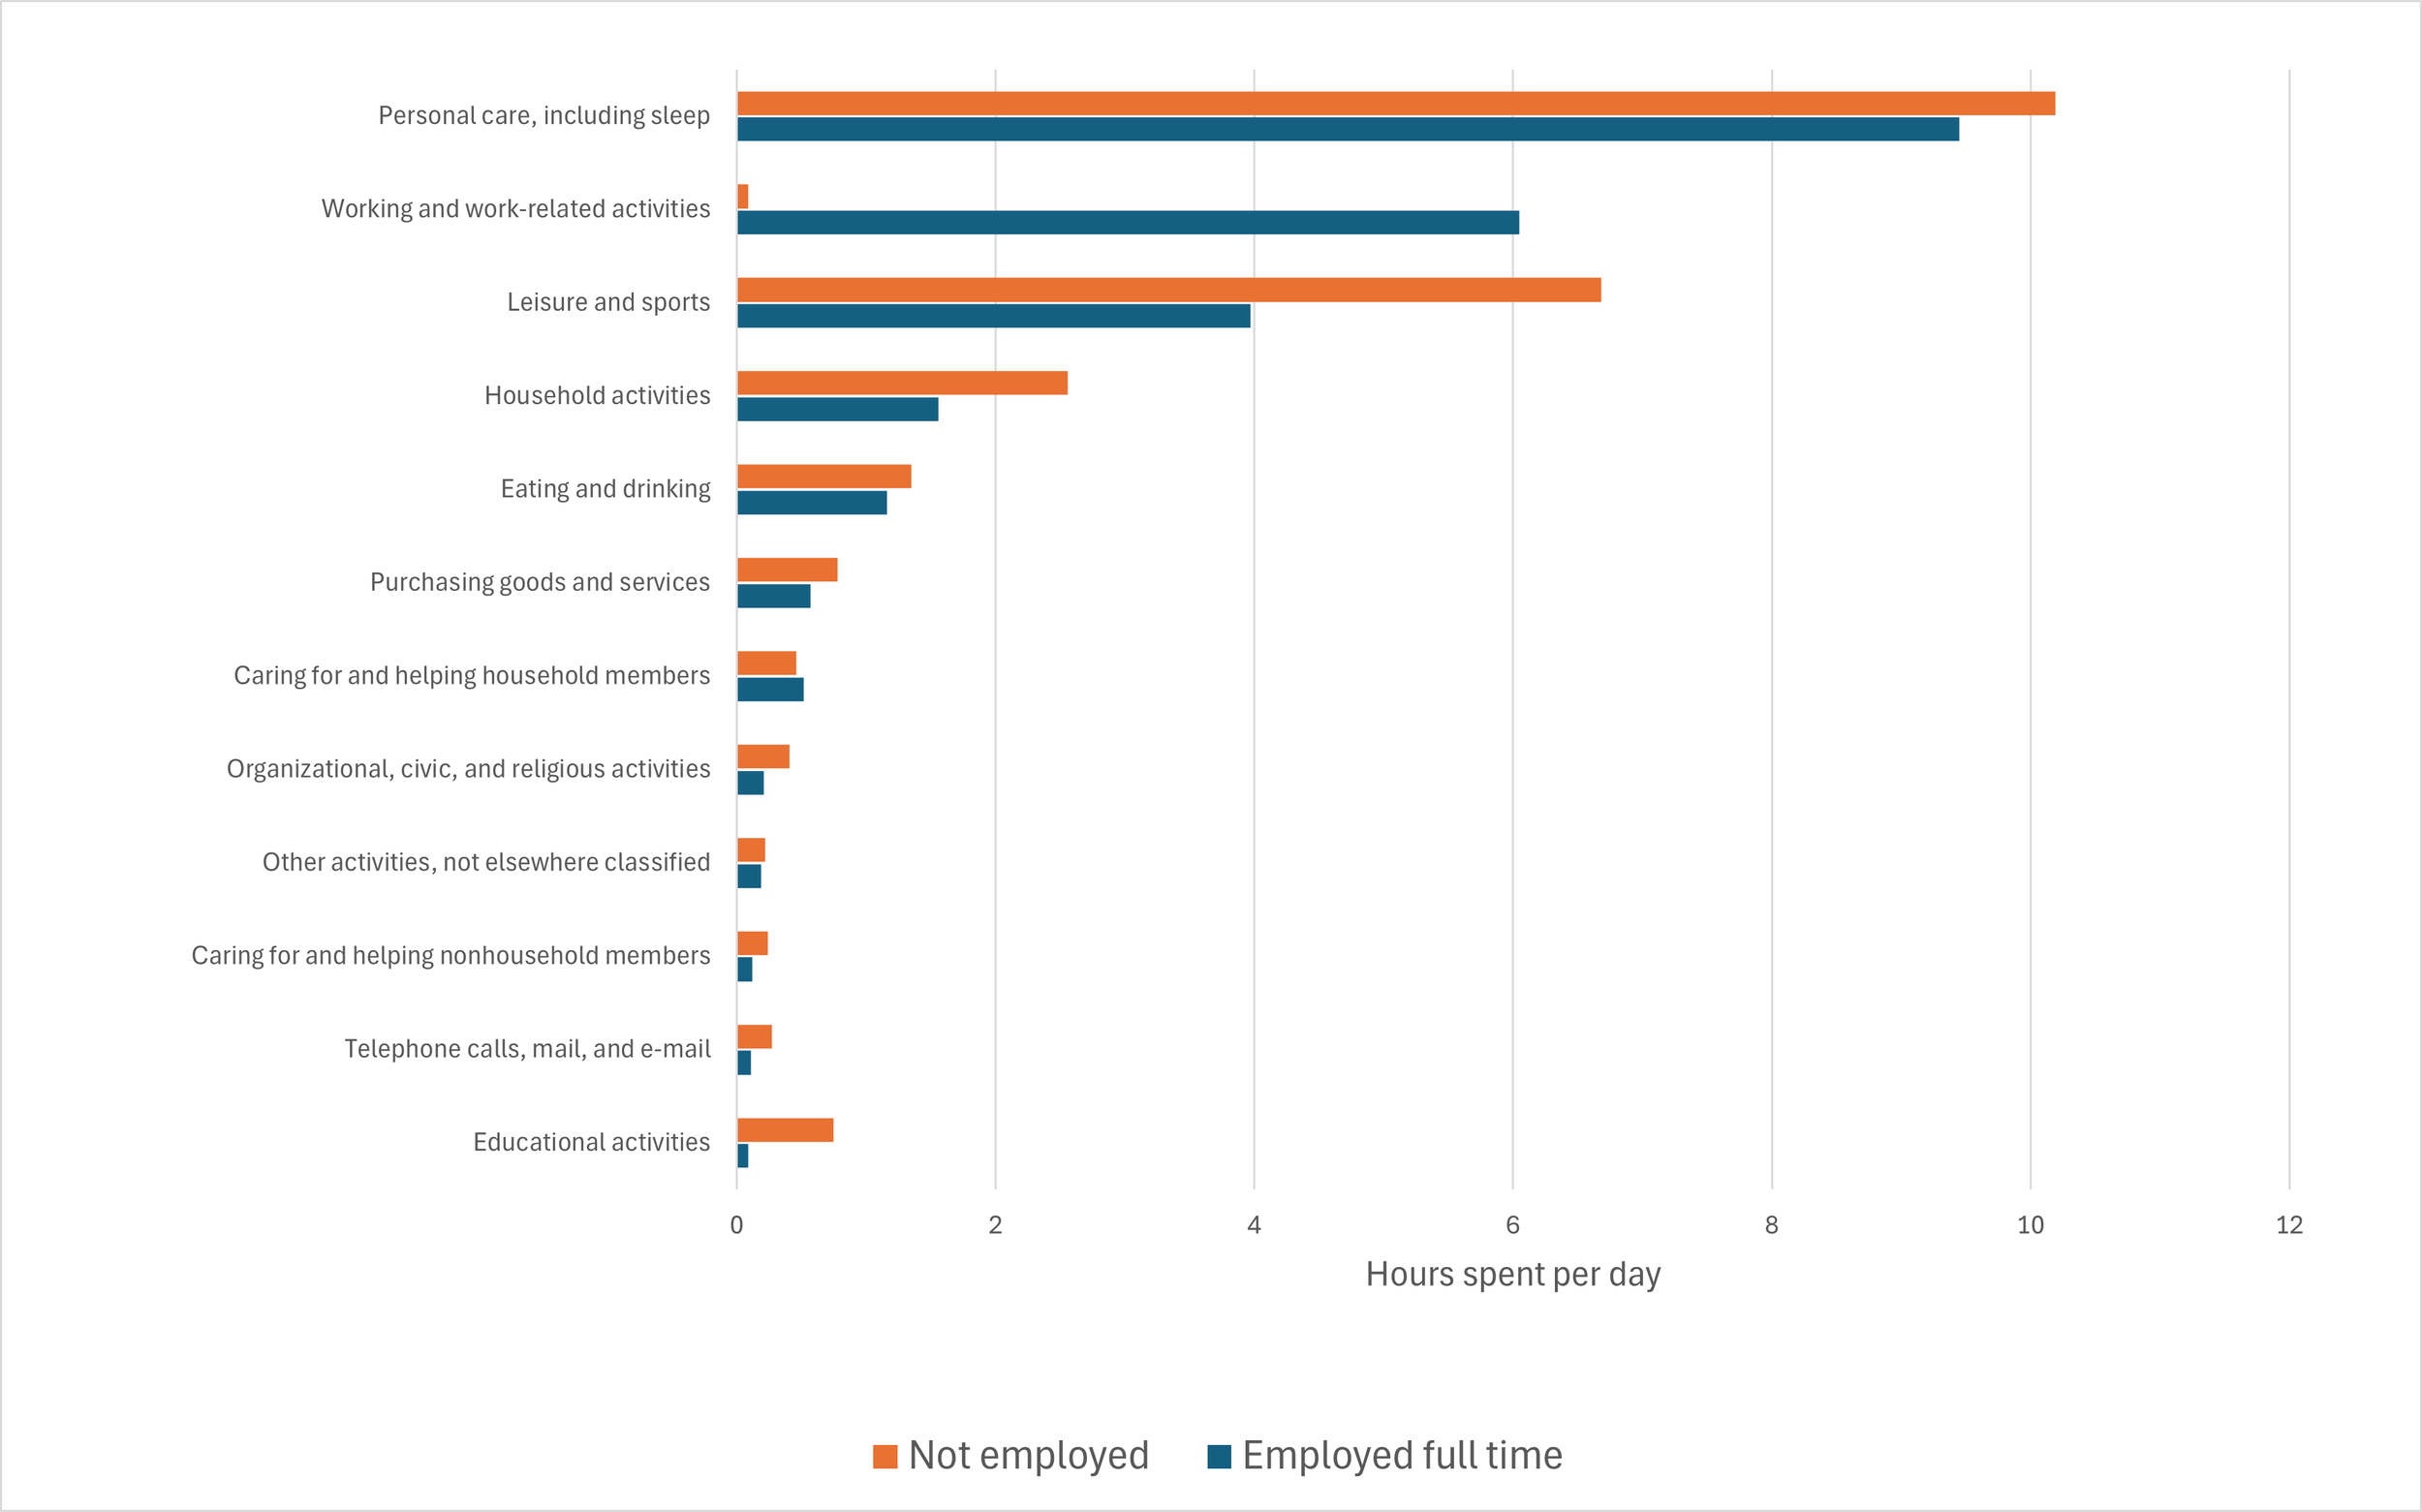
Figure 1: People without jobs spend more time on leisure and household activities
The biggest difference between people who work full time and people without jobs is naturally the time spent working. On an average day, someone who is employed full-time spends about 6 hours working, compared to only about 5 minutes for people without jobs. While these people may not directly be engaged with the labor market, this creates an opportunity for them to engage in other valuable activities.
The category that people without jobs spend the most time on relative to people with full time jobs is “leisure and sports.” On average, someone without a job will spend an additional 2.7 hours on leisure activities (6.7 hours compared to 4.0). This makes up about 28% of the total day for someone without a job.
A few years ago, my colleague Rob Moore wrote about leisure time and how it is an important part of a well functioning economy. People find relaxation and fun valuable, and so time spent on those activities is a benefit to the economy even if it doesn’t grow GDP.
The category that non-workers see the second largest increase in time spent on is “household activities.” This is a category of time spent that is much more understandably productive, even though it still is not captured by our mainstream definitions of the economy. People without jobs on average spend an additional hour per day on household activities (2.6 compared to 1.6).
The next biggest difference between workers and non-workers is the amount of sleep each group gets on average. People without jobs spend about 45 extra minutes per day on “personal care, including sleep” when compared to non-workers. Fortunately, both groups spend more than eight hours on this category on average (10.2 compared to 9.5)
The last category where there is a difference of more than 30 minutes is the time spent on “educational activities.” The average person without a job spends about 45 minutes on educational activities every day compared to only 5 minutes for people who work full time.
There are few things we can learn from this. One is that when people aren’t working, they tend to substitute about half of those hours with added leisure time. This is an important reminder that leisure is extremely valuable, and people tend to prioritize it.
Another important takeaway is that there is a lot of non-market productivity that happens outside of working hours. Both people with jobs and those without spend considerable portions of their day taking care of household chores and other family members.
Notably, people without a job are not caring for family members any more than people with full-time employment. This means people who are not working are not using this freed up time to care for children or elderly family members.
The American Time Use Survey will continue to provide countless insights for policy makers. Understanding how people spend their time and how these trends change in response to policy decisions can be an important tool in ensuring the economy succeeds in getting people the things they want.