

By Noah Stein and Rob Moore
Unless you’ve been living under a rock for the past month, you know that both governments and households have been implementing social distancing measures in order to combat the rapid spread of COVID-19. By slowing infection rates and flattening the curve, they hope to see vast reductions in both deaths and economic turmoil.
Economic analyses suggest successful social distancing has the potential to provide reductions in risk of death of a value of $5 trillion to $8 trillion, that’s up to $60,000 per US household. Despite the long term benefits, social distancing measures will likely impair industries that are unable to adapt and will hurt metro areas that are not suited for a noncontact economy.
Communications and information technology innovation is providing opportunities for remote work that wasn’t previously possible, but not all industries can adjust. Gyms, movie theatres, airlines, etc. are closing with no option to continue operations online. This could potentially result in Great Depression levels of unemployment.
A recent study done by the Becker Friedman Institute at the University of Chicago suggests that 34% of jobs nationwide can be conducted remotely. Most of Ohio won’t be this lucky, though. Looking at Ohio’s metropolitan areas, we can identify which cities in Ohio are most prepared for remote work.

Data from the Becker Friedman Institute.
From this chart we can see that larger metro areas (Columbus, Akron) have more potential to switch to telework than smaller metros (Mansfield, Lima).
As the share of jobs that can be done remotely decreases, so does average pay. The metro areas that have less jobs that can be done remotely will likely experience both higher unemployment numbers and lower average wages. These will be the areas in Ohio that feel the negative impact of social distancing the most.
The following chart gives more insight into how many jobs are at risk due to strict social distancing measures. This is drawn from a Brookings Institution study that examined how much leisure & hospitality, employment services, transportation, mining, and travel arrangement services comprise metro employment, industries that are especially at risk under social distancing measures.

Data from The Brookings Institution.
Nearly all Ohio metro areas have a significant amount of jobs in high-risk industries. Using a metro area’s potential for remote work as well as job loss, we can make predictions about which metro areas will be hit the hardest.
Low-Risk Metro Areas
Akron, Cleveland, and Dayton all have above average potential for remote work as well as lower shares of jobs put at risk. Metro areas like these will likely be the least impacted by the economic downturn with less jobs lost and more jobs done from home.
High-Risk Metro Areas
Springfield, Toledo, Youngstown, and Wheeling are less fortunate. These metro areas have the lowest rates of potential remote work as well as above average numbers of jobs in high risk industries.
Wildcards
The remaining Ohio metro areas are less predictable. This is because they have either high potential for remote work as well as high numbers of at-risk jobs (Cincinnati and Columbus), or low potential for remote work and less at-risk jobs (Canton, Huntington-Ashland, Lima, Mansfield, and Wierton-Stuebenville). The former may have more jobs at risk but they also have more potential to adapt, the latter will have more difficulty adapting but less jobs that will be affected. Predicting the outcome of these areas is less straightforward.
With a few weeks of strict social distancing under our belts, we are already seeing the results of social distancing policies in unemployment rolls. The following chart shows the spike in initial unemployment claims in Ohio’s metro areas as reported by the Ohio Department of Job and Family Services.
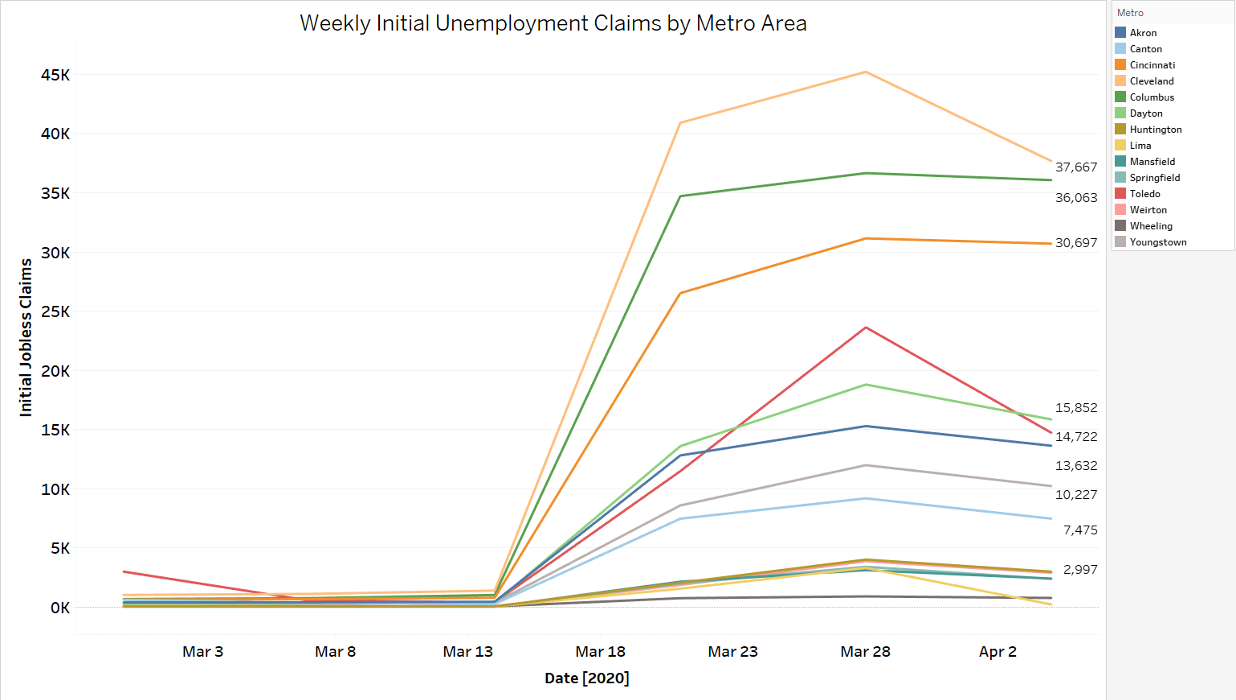
Data from the Ohio Department of Job and Family Services.
This chart tracks all metro areas’ initial jobless claims from February 29th to April 4th. Each area has seen significant increases in claims, some more than others. By looking at the rate of the increasing claims we can compare how each metropolitan area is being affected. This information can be used to show which areas are receiving the most claims relative to their baseline averages. For example, Springfield saw a 4233% increase in average initial jobs claims while Canton only saw a 1932% increase. Given the data we have on share of at-risk jobs and rate of potential telework this seems plausible: Springfield is considered high risk while Canton is a wildcard.
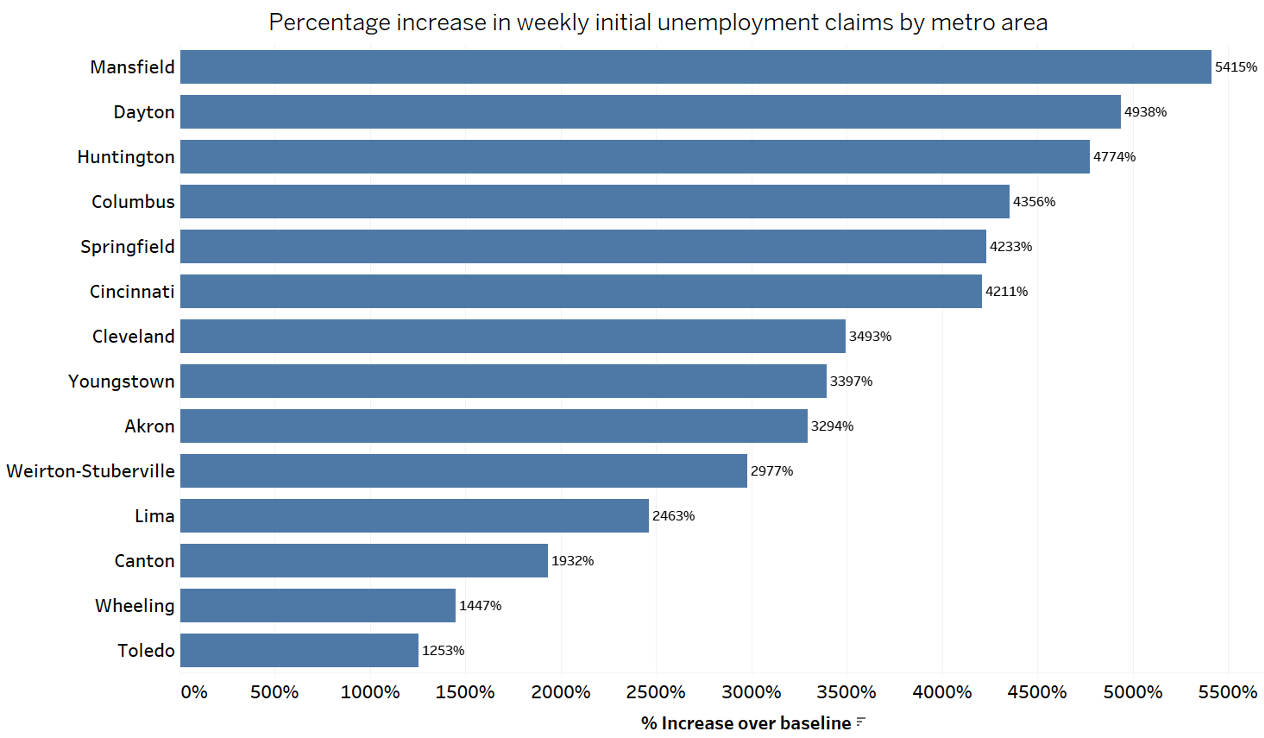
Data from the Ohio Department of Job and Family Services.
Ideally, this information can be utilized to better understand why certain areas struggle more than others. Using the data at our disposal we can do our best to predict and mitigate job loss while better understanding how certain areas manage to adapt.