Income inequality in the United States

One thing I find interesting about income inequality is how, unlike other parts of our society that are widely believed to be a flaw, there is a strong economic case to be made that at least some inequality might be healthy. Severe income inequality is unacceptable, but it seems to be alright to allow people to earn different incomes based on different levels of contribution to society. 

Compare this to something like pollution. We still tolerate some amounts of pollution as a byproduct of economic activity, but unlike income inequality, it would still be better if we could eliminate pollution entirely. 

Income inequality is the byproduct of a wage economy where people earn more largely based on how difficult their skills are to replace. There isn’t a technological fix for this like there hopefully is for pollution. 

To quantify income inequality, we most commonly look at an area’s Gini Coefficient, a single number that quantifies how far a community is from perfect income equality. A number close to zero means that a community has very low levels of inequality, and a number close to 100 means that a place has extreme disparities. 

The World Bank calculates that the United States has a Gini Coefficient of 39.8, which is solidly in the top half of countries in terms of inequality. The highest national Gini Coefficient is South Africa’s 63, calculated in 2015. Of the more recently calculated numbers, Brazil has the highest at 52.9.

However, if we want to get a much more detailed picture of what income inequality looks like in this country, we can look at the Gini Index for each state. Below is the data as calculated and published by the Census Bureau.

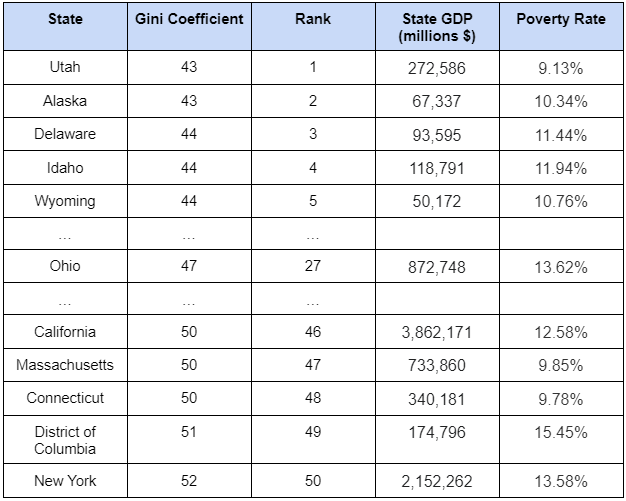
A few things jump out to me about these results. First, all of these coefficients are higher than those calculated by the World Bank. An important thing to recognize about the Gini Coefficient is that it is sensitive to how it is calculated. In particular, the number of income bins used for each region. 

Another finding is that it appears that a state’s Gini Coefficient is somewhat correlated with their total GDP. It makes some intuitive sense that states with larger nominal economies would have more inequality since we often assume that inequality is a tradeoff that comes with growth. 

The states with low Gini Coefficients are relatively smaller, and have fairly low poverty rates. Alaska is a unique case because despite the fact that a large part of its economy is the result of its oil industry, it repurposes some of that profit to fund a basic income program as a state. 

While the overall gap between states is fairly small (it is roughly equivalent to the gap between the United States and France on the World Bank’s list), it does highlight some important facts about state economies. 

Right now, it appears that in the United States, strong economic growth results in high inequality, but that doesn’t have to be the case. Alaska is a great example of this, where by repurposing the benefits that arise as a result of their economic growth, they can prevent rampant inequality. Inequality is, at least partially, a policy choice.

How did Ohio’s workforce change in 2022?

Last year, I wrote a blog post looking at the most common jobs in each income decile in Ohio, which was inspired by an NPR blog post looking at the most common jobs nationally. I’ve recently been working on another project that had me looking at the most common jobs for low income people in Ohio, so I thought it would be interesting to see how the most common jobs have changed if at all. 

Incomes went up

The first thing I noticed when redoing this analysis was that the incomes were higher in 2022 than they were in 2021 across the board. This is a good sign for workers who were faced with rising prices during 2022. 

Although there is no one definition of the middle class, if we look at the middle deciles we see that the income boundaries moved up by about $3,000 - $4,000. The increase in incomes seems to be larger for people who previously earned more, suggesting that the economic gains were more strongly concentrated at the top. Low-income workers still saw a wage increase, but theirs was much smaller. 

Moderate income mobility within professions remains the norm

In both the 2021 and 2022 data, many of the most common professions appear across multiple income brackets. This is largely because these are the most common occupations, and there are bound to be people earning lots of different salaries within each field, but it tells us that there is room for upward mobility in lots of these occupations as well. 

The most relevant example of this is the laborers / freight, stock, and material movers. Many people working in that profession can have incomes ranging from deep poverty all the way up to the upper middle class.

There are some examples of industries that appear to only employ people at extremely low wages. Many consumer-facing service industry workers appear as common employees only in the lowest income brackets. It seems as though people working in these professions would need to change careers in order to achieve upward economic mobility.

The top-earning professions never earn less

One thing that strikes me about the most common jobs in the highest income brackets is that we don’t see them lower down on this list. In other words, there aren’t really many lawyers and doctors who fail to earn in the highest categories. 

On the other hand, this means that if you don’t already work in one of these professions it is very unlikely that you will find your way into the highest income brackets. There appears to be a cap on upward mobility right near the high end of what most people would consider upper middle class. To break into the upper class, people need to be working in certain fields. 

What occurs to you looking at these data?

Ohio economists tepid on economic impact of income tax repeal

In a survey released this morning by Scioto Analysis, 11 of 19 economists disagreed that Ohio will experience significant economic growth if lawmakers eliminate its state income tax, while four agreed and four were uncertain. There is currently legislation under consideration that would eliminate the state income tax in Ohio, and supporters claim that eliminating the tax will strengthen Ohio’s economy and encourage businesses and workers to move to the state. 

Will Georgic from Ohio Wesleyan wrote “I think that Ohio is more like Kansas than its lawmakers want to admit (and certainly more like Kansas than we are like Florida, Washington, Nevada, or Texas). This experiment did not go well for Kansas.” In contrast, Jonathan Andreas from Bluffton University wrote “Although the Federal income tax is a pretty efficient and very progressive way to generate revenues, state income taxes like Ohio's are relatively regressive and Ohio's is particularly burdensome relative to the smaller amount of revenue given that Ohio has three income tax authorities: state, school district, and local! That is an absurd amount of bureaucracy for a much smaller amount of tax revenues than the Feds get. I'd prefer that we just pay one income tax to the Feds and have states generate revenues primarily through higher land taxes which are more efficient and about as progressive.”

Whether or not removing Ohio’s income tax leads to economic growth, it will present a challenge to lawmakers who have a mandate to keep the state’s budget balanced. 18 of 19 economists surveyed agreed that it will be difficult for lawmakers to keep a balanced budget if they eliminate the income tax. 

As Paul Holmes from Ashland University wrote “Raise taxes elsewhere or reduce spending. Both are difficult.”  Similarly, Bob GItter from Ohio Wesleyan wrote “We cannot eliminate more than 1/3 of our State's General Revenue Fund without dire consequences.”

The Ohio Economic Experts Panel is a panel of over 40 Ohio Economists from over 30 Ohio higher educational institutions conducted by Scioto Analysis. The goal of the Ohio Economic Experts Panel is to promote better policy outcomes by providing policymakers, policy influencers, and the public with the informed opinions of Ohio’s leading economists. Individual responses to all surveys can be found here.

What if Ohio had cleaner rivers, lakes, and streams?

In 2022, a childhood friend of mine was married in Denmark.

I flew out to Copenhagen with a few of my friends and we spent the week seeing a very different life than we were used to living in Ohio.

As someone whose primary mode of transportation is my bicycle, I was of course impressed by the bike infrastructure in the city. It was hard to not appreciate a place where biking is the norm rather than something you get yelled at by motorists for doing.

But what I keep going back to when I think about Copenhagen is the quality of their public waterways. Every day after work there were hundreds of young people hanging out next to the canal, taking dips in the water. We ended up taking a boat around and jumping into the water along the way.

This is a canal that goes right through the city center of Copenhagen. Could you imagine that being the norm in the Cuyahoga, Ohio, or Scioto rivers?

When I asked people about this phenomenon, they told me that the canal did not used to be swimmable. They talked about how a large ballot initiative was passed a decade ago and it was cleaned up so now it is safe enough to swim in. This was a decision made by residents of the city.

Ohio’s waterways are one of its most valuable assets. Before the railways came through, Ohio had one of the most extensive canal systems in the world. Even today, University of Toledo Economist Kevin Egan says that the counties along Lake Erie account for a majority of the state’s tourism industry.

And the state is making strides to improve its water quality. The H2Ohio program is helping curb fertilizer runoff. Ohio State University recently was awarded $4.9 million for water quality initiatives.

It is needed. According to objective measures, Ohio has exceptionally poor water quality. I was in a meeting earlier this year where a data analyst with the Ohio EPA disputed this claim, saying that Ohio looks bad because we do more testing than other states. I asked him for the data to support this claim but he failed to get back to me about it.

So as it stands today, objective measures say Ohio’s water quality is poor and evidence we have about how people use our public waterways suggests people who engage in public recreation think so, too.

But what if that changed? What if our rivers in our cities and in the country were safer places to use for swimming, boating, and fishing? Recent trends in migration within the United States suggest that rural areas that are growing are those with a capacity for recreation. Improving the water quality of Ohio’s streams, rivers, and lakes could be a boon for rural counties looking to figure out what their future economy looks like.

On top of that, there are benefits to clean surface water. Ecological diversity will make our ecosystems more resilient. In an era of changing climate, resiliency matters. And it won’t just be good for plants, animals, and ecosystems: it will be good for people, too.

This commentary first appeared in the Ohio Capital Journal.

How do state taxes relate to state GDP?

One topic I have been interested in for a long time is how different states collect taxes.

We have some great resources in the United States to understand how taxes are collected by state government. With the rich data available to us, someone could build a career studying how taxes are collected by the states.

One important statistic we can use to understand how taxes are collected by U.S. states is the percentage of GDP collected in state taxes.

We can easily calculate this statistic by using data from the U.S. Census of State and Local Finance and the Bureau of Economic Analysis. Below are the 50 states, their 2021 state taxes collected according to the Census of State and Local Fiance, their 2021 GDP according to the Bureau of Economic Analysis, and the ratio of their taxes to state GDP.

A few things stand out to me here. First, the states at the top are not necessarily all Democratically-controlled high-tax states. Arkansas, Mississippi, and West Virginia are also in the top 10 for highest percentage of GDP collected by the state government in the form of taxes. These three states, along with fellow top-10 state New Mexico, are four of the poorest states in the country. This means that the top 10 states are a mixture of blue states with high taxes and high-poverty states.

Looking at the bottom of the list, the trend that stands out to me is the prevalence of states without income taxes. Six of the nine states without income taxes are also in the ten states with the lowest percentage of GDP collected in state taxes. Alaska, which only collected 1.8% of GDP in taxes, the lowest in the United States, has neither state income nor state sales taxes, depending mostly on oil revenues to raise state taxes.

Living in Ohio, I am of course always looking to Ohio to see how it stacks up regionally. Interestingly enough, Ohio ranks lower than all of its neighboring states, only collecting 4.6% of state GDP in taxes. The next closest is Pennsylvania, which collects 5.9% of GDP in taxes. Indiana (6.3%), Kentucky (6.1%), Michigan (6.0%), and West Virginia (7.0%) each collect more. This is especially notable because members of the Ohio General Assembly are working right now to eliminate the state income tax.

What I take away from this quick analysis is that the percentage of taxes collected compared to GDP is a function of both policy and economic landscape. Some states, like Hawaii, Minnesota, and Vermont, have high state taxes that lead to higher collection of taxes compared to state GDP. Others, like Arkansas, Mississippi, and West Virginia, have fewer resources to collect in the first place. There are states like New Mexico that have relatively high taxes and low resources. Then there are states like Alaska, New Hampshire, and Texas, that decline to raise revenue at all.
What this analysis does not tell us, however, is what good policy looks like. Do these taxes drag the economy? Do they reduce poverty and inequality? Do they fund effective and efficient programs? More detailed analysis is necessary to answer all or even any of these questions. But it is valuable to get this sort of big-picture idea to help us understand how states are utilizing their economic resources.

Hospital price transparency could save Ohioans on medical care

Last Wednesday, the Ohio Senate passed a bill to require hospitals to publish the cost of their services for the public to see.

The Senate version of the bill requires hospitals to publish estimates of the prices of their services. This is in contrast to the House version of the bill which would require hospitals to publish standard service prices and allow patients to submit complaints to the Ohio Department of Health about hospitals that do not publish their prices.

If you have had any interaction with the U.S. health care system, which if you are reading this article I’m assuming you have, then you have likely experienced the frustration of not knowing how much you will pay for health care services. You usually do not know how much you will pay for something until after you have received it. 

In this way, health care providers play games not so different from the man who washes your car windshield then demands payment for it. In both these cases, consumers are in the dark and the “market” does not function because there is not a fair exchange based on full information of expectations from both parties.

This has led to a system where Ohioans are saddled with bills they cannot pay. Researchers at the Urban Institute estimate 15% of Ohioans have medical debt in collections. Medical debt is even more common in communities where at least 60% of the residents are people of color, where a full 21% of residents have medical debt in collections.

Health care debt has become such a big problem in Ohio that multiple communities like Toledo and Columbus are working to create centralized programs to forgive medical debt. And hospitals are on board — they are willing to sell debt for one cent on the dollar because the chances of them recouping any of this debt is so low.

According to the Health Policy Institute of Ohio, Ohio is 44th in the country among states in health value, spending more per capita than the average state on health care and still ending up with much worse health outcomes. Ohioans spend over $10,000 per capita on health care, a significant amount considering the per capita income in Ohio is about $60,000.

Most health care experts agree wholesale reform is the most sustainable way to get health costs under control in Ohio and across the United States. I recently had a close friend who grew up here with me in Bexley visit from his new home in Denmark. In that country, hospitals are owned by their equivalents of states. They negotiate with the doctors’ unions to determine prices. 

People in Denmark spend about 9.5% of their income on health care. And they spend more than the OECD average. If Ohio spent that much, the average person would only spend $5,700 on health care a year, $4,700 less than they do now. What would you do with an extra $4,700 a year?

Price transparency won’t get us all the way to European health care spending levels. But it certainly will help. Anything we can do to fix the market will help reduce costs and relieve the burdens on families.

This commentary first appeared in the Ohio Capital Journal.

Do taxes change how people work?

Right now, I am working on modeling the impacts of a Child Tax Credit in Ohio. One of the questions I am trying to answer is how introducing a new tax credit will impact peoples’ decision to participate in the labor force.

The particular phenomena I am interested in is called the Benefit Cliff, where small changes in earned income can result in large changes in benefit amounts. For example, if we say that only people who earn less than $50,000 annually get $1,000 in benefits, then it would be beneficial for someone earning $50,000 to  reduce their earned income somehow, either by working less or taking a pay cut in order to qualify for the benefit. If there is a minimum amount needed to qualify for a benefit, then low-income individuals would have a greater incentive to increase their earned income to take advantage of the new credit. 

We can change how severe the benefit cliff is by including benefit phase-ins and phase-outs. This approach is common for tax policies such as the Earned Income Tax Credit. The purpose of structuring our benefits like this is to reduce the benefit cliff, particularly the disincentive that exists as the benefit goes away. 

In practice, benefit cliffs don’t have as severe of a workforce impact as they potentially could. This is because in the real world, people don’t often have the ability to fine tune how much labor they choose to supply. People get scheduled in shifts, they don’t often get to negotiate how long those shifts are. 

In theoretical terms, we call this a labor demand constraint. Employers don’t purchase labor on a continuous spectrum, they purchase it in discrete increments. Additionally, those increments regularly come in the form of contracts that are not flexible in the short term, reducing the ability of individuals to adjust their labor supply in response to tax changes. 

Despite this, there are two reasons why we still expect a new child tax credit to have an impact on Ohio’s workforce. First, all of the  practical concerns above exist in the short to medium term. In the long run, people can adjust their working habits to maximize their utility in light of a new tax credit. 

Second, we are currently in a historically tight labor market. Unemployment is extremely low, and employers are having difficulty finding people to fill open positions. This reduces labor demand constraints, and gives more power to individuals to choose how much they want to work. 

I’m still crunching the numbers to figure out exactly what this impact will be, but I suspect the net result will be fairly small. The far more substantial impact will be the money that goes to low- and middle-income families with young children. 

We saw during the pandemic just how significant the Federal child tax credit was in reducing child poverty. Even if there are some negative workforce impacts, it is very likely that the benefits will outweigh those costs. 

Analysis: Minimum wage increase will save 4,000 lives in first ten years

This morning, Scioto Analysis released a new cost-benefit analysis exploring what the impact of raising Ohio’s minimum wage would be. Research on minimum wage increases has shown that it can lower the suicide rate, prevent homicides, and lower infant mortality. Our model predicts that because of these three impacts, raising the minimum wage to $15 an hour in Ohio would save approximately 4,100 lives over the next 10 years. 

The primary cost of raising the minimum wage in Ohio would be an increase in unemployment. We estimate that as many as 73,000 Ohioans could lose their jobs as a result of this change, which amounts to a rise in unemployment of a little over 1%.

Using commonly accepted values for the costs and benefits, we estimate that raising the minimum wage in Ohio will generate about $25 billion in economic value for the state by 2036. The benefit of reducing deaths outweighs unemployment costs from an economic perspective. 

Currently, there are two minimum wage proposals Ohio is considering. There is a ballot initiative that would raise the minimum wage to $15 an hour by 2026 and Senate Bill 256 which would raise the minimum wage to $15 an hour by 2028. Our model is based on the ballot initiative parameters, which suggests that if Senate Bill 256 is passed we should expect slight lower costs and benefits, as the real impact on wages will be lower.

Policy analysis with an open mind

In the most recent edition of the Journal of Policy Analysis and Management, there was an article titled Medicaid generosity and food hardship among children. In this paper, the researchers Nicholas Moellman and Cody Vaughn explored the impact that Medicaid had on food insecurity. 

They found that having a child eligible for Medicaid reduced household food insecurity by 20%. This effect was stronger for Black and Hispanic households.

At first glance, this seems like a surprising result. Medical expenses covered by medicaid are not always consistent like food expenses. 

More generally though, resources are resources. If a family has unavoidable medical expenses, then Medicaid may allow them to not sacrifice spending in other parts of their lives. As noted in the Federal Reserve’s Survey of Household Economics and Decision Making, 37% of adults would not be able to cover a $400 emergency expense with cash. 

One inpatient day at an Ohio non-profit hospital costs on average $3,402 according to data from Kaiser State Health Facts. It makes sense that if a low-income family had to pay for a hospital stay for any reason, it could impact their ability to afford food. 

This result is interesting in itself, and policymakers should pay attention. Additionally, this paper reveals some key insights about the policy analysis process. In particular, I think it highlights the importance of two steps of the Eightfold Path.

Problem Definition

Food insecurity is not strictly an issue about lacking food, it is an issue about lacking resources. There are very few places in the United States where the reason someone is food insecure is only because they don’t have access to food, even though they have enough money. 

Food insecurity is often the result of people having to stretch their limited resources too thin, and sacrificing food intake as a result. As these researchers show, when we reduce resource burdens in one area, we find that people shift their consumption in response. 

As policy analysts, the lesson we can learn is that no problems exist in a vacuum. When identifying and defining problems, it is important to find the root cause.

Imagine a hospital is regularly over capacity. Without understanding why, we might predict the best course of action is to build a new hospital wing. However, if we know that the primary reason the hospital is always crowded is because the city’s drinking water is contaminated, then we can more efficiently address the problem. 

Criteria Selection

When selecting what criteria to measure a policy on, it is important to be open minded. All parts of the economy are connected, and analysts should always be thinking about what the impacts of a policy change might be several steps downstream.

This isn’t to say that analysts should always consider every possible impact. Policy analysis is always resource constrained, and there it is impossible to fully explore all outcomes. A skilled analyst should be able to both think outside the box and realize when certain avenues aren’t worth their time. 

At the beginning of a project, everything should be on the table. Criteria selection is one area where a lot of analyst bias can inadvertently be introduced. Giving some consideration to what may appear to be unrelated criteria is one way to increase the validity of an analysis.

Scioto Analysis collaborates on report on California's home and community-based services

For the past year, Scioto Analysis has worked with Northeastern University and Caring Across Generations on a report on home and community-based services in the state of California. This culminated in a report that was released last month.

On March 11, 2021, President Biden signed the American Rescue Plan Act of 2021 (ARPA), which allocated a historic level of funding for Medicaid Home and Community-Based Services efforts in California.

Home and community-based services, also known as HCBS, are services that people with disabilities and older adults utilize to live independently in their own homes and communities. HCBS supports people with disabilities and older adults with activities of daily living, such as getting dressed, preparing meals, assisting with medications, maintaining employment, and using transportation. Over half of the $3 billion in enhanced federal spending sent to California was used to support the state’s caregivers.

Three years later, many of the ARPA funded programs are coming to an end, and this report finds that the specific programs funded that were aimed primarily at in-home caregivers would still leave in place a care system without sustainable investment.

Key findings of this report include:

• Caregivers supporting disabled people, despite state attempts to raise their pay, experience significant dissatisfaction with their pay and working conditions, even as caregivers continue to gain personal satisfaction from their work.

• Paid job training programs aimed at both In-Home Supportive Service (IHSS) and other care workers, were popular and effective but reached relatively few people and continue to overlook the need to make any changes to a system that fails to provide compensation reflective of the knowledge and skill of this workforce.

• Rushed implementation, contractual challenges, and short timelines hampered the effectiveness of new programs, making them more expensive to launch and operate. Spending deadlines approached just as the programs were reaching their peak effectiveness.

• Many family caregivers finally gained new opportunities to access training programs, respite care, and other services, but too few resources were directed at this large population, and these caregivers continue to be underserved by state and federal agencies.