2023 Year in Review: Scioto Analysis Celebrates Five Years

We get it: you probably don’t follow each Scioto Analysis release with rapt attention. That is why at the end of the year I like to write a round-up of studies you may have missed from the year.

This was our fifth full year as a social impact policy analysis firm and we published nine large analyses on top of the smaller analyses we do throughout the year. Below is a roundup of the five analyses we at Scioto believe were the most impactful.

Pennsylvania’s Looming Climate Crisis: The Rising Price to Protect Communities from Extreme Heat, Precipitation, and Sea Level Rise

In 2021, Scioto Analysis started working with a coalition of local governments in Ohio to estimate the cost of climate change for local government budgets down the road. That culminated in the study “The Bill is Coming Due: Calculating the Financial Cost of Climate Change to Ohio’s Local Governments”, which made news throughout Ohio and even resulted in one of the sponsors of the research testifying in Washington D.C. during consideration of the Inflation Reduction Act in 2022.

This year, we followed that up with a study on the state of Pennsylvania. This time around, we zeroed in equity, finding that rural and high-poverty municipalities will have to pay more per capita due to climate change costs such as road maintenance and landslide protection. The study was covered by outlets such as CBS and the Pennsylvania Capital-Star.

Cost-Benefit Analysis of Ohio’s Recreational Cannabis Legalization

Over the past few years, Scioto Analysis has been doing a series of cost-benefit analyses demonstrating how cost-benefit analysis is carried out when done well. These cost-benefit analyses have covered topics ranging from the earned income tax credit to school closings for COVID-19 to urban tree canopy programs.

We do this as part of our social bottom line mission: we think policy analysis should be better in state and local government. For policy analysis to improve we must first show what good policy analysis looks like.

Over the summer, when we were considering a new cost-benefit analysis to conduct, we decided to study legalization of recreational marijuana in Ohio. Little did we know at the time that voters would be deciding on this question in November.

In October, we released our cost-benefit analysis, which found tax revenue generated by the proposed policy would generate benefits far in excess of the costs of legalization. The study was covered in a range of national news outlets, including Forbes, the Center Square, the Ohio Capital Journal, Crain’s Cleveland Business, Benzinga, Morningstar Marketwatch, Ganjapreneur, Green Market Report, High Times, and Marijuana Moment.

The Ohio Human Development Report

If policymakers want to know where they can take their community, they need to first understand where their community is. Alongside our work to promote better cost-benefit analysis, we have been conducting a multiple-year study focused on this question: how can we baseline well-being in a community?

We are using Ohio as a case study and have released a series of studies on inclusive economic growth (including our GPI 2.0 study, which came out earlier this year). We have also released studies on poverty and inequality.

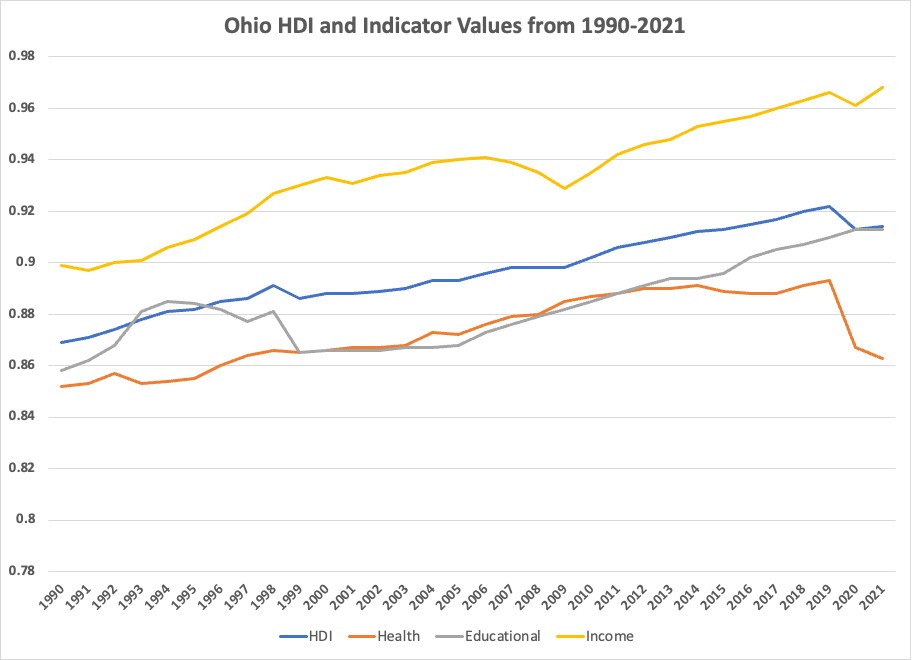
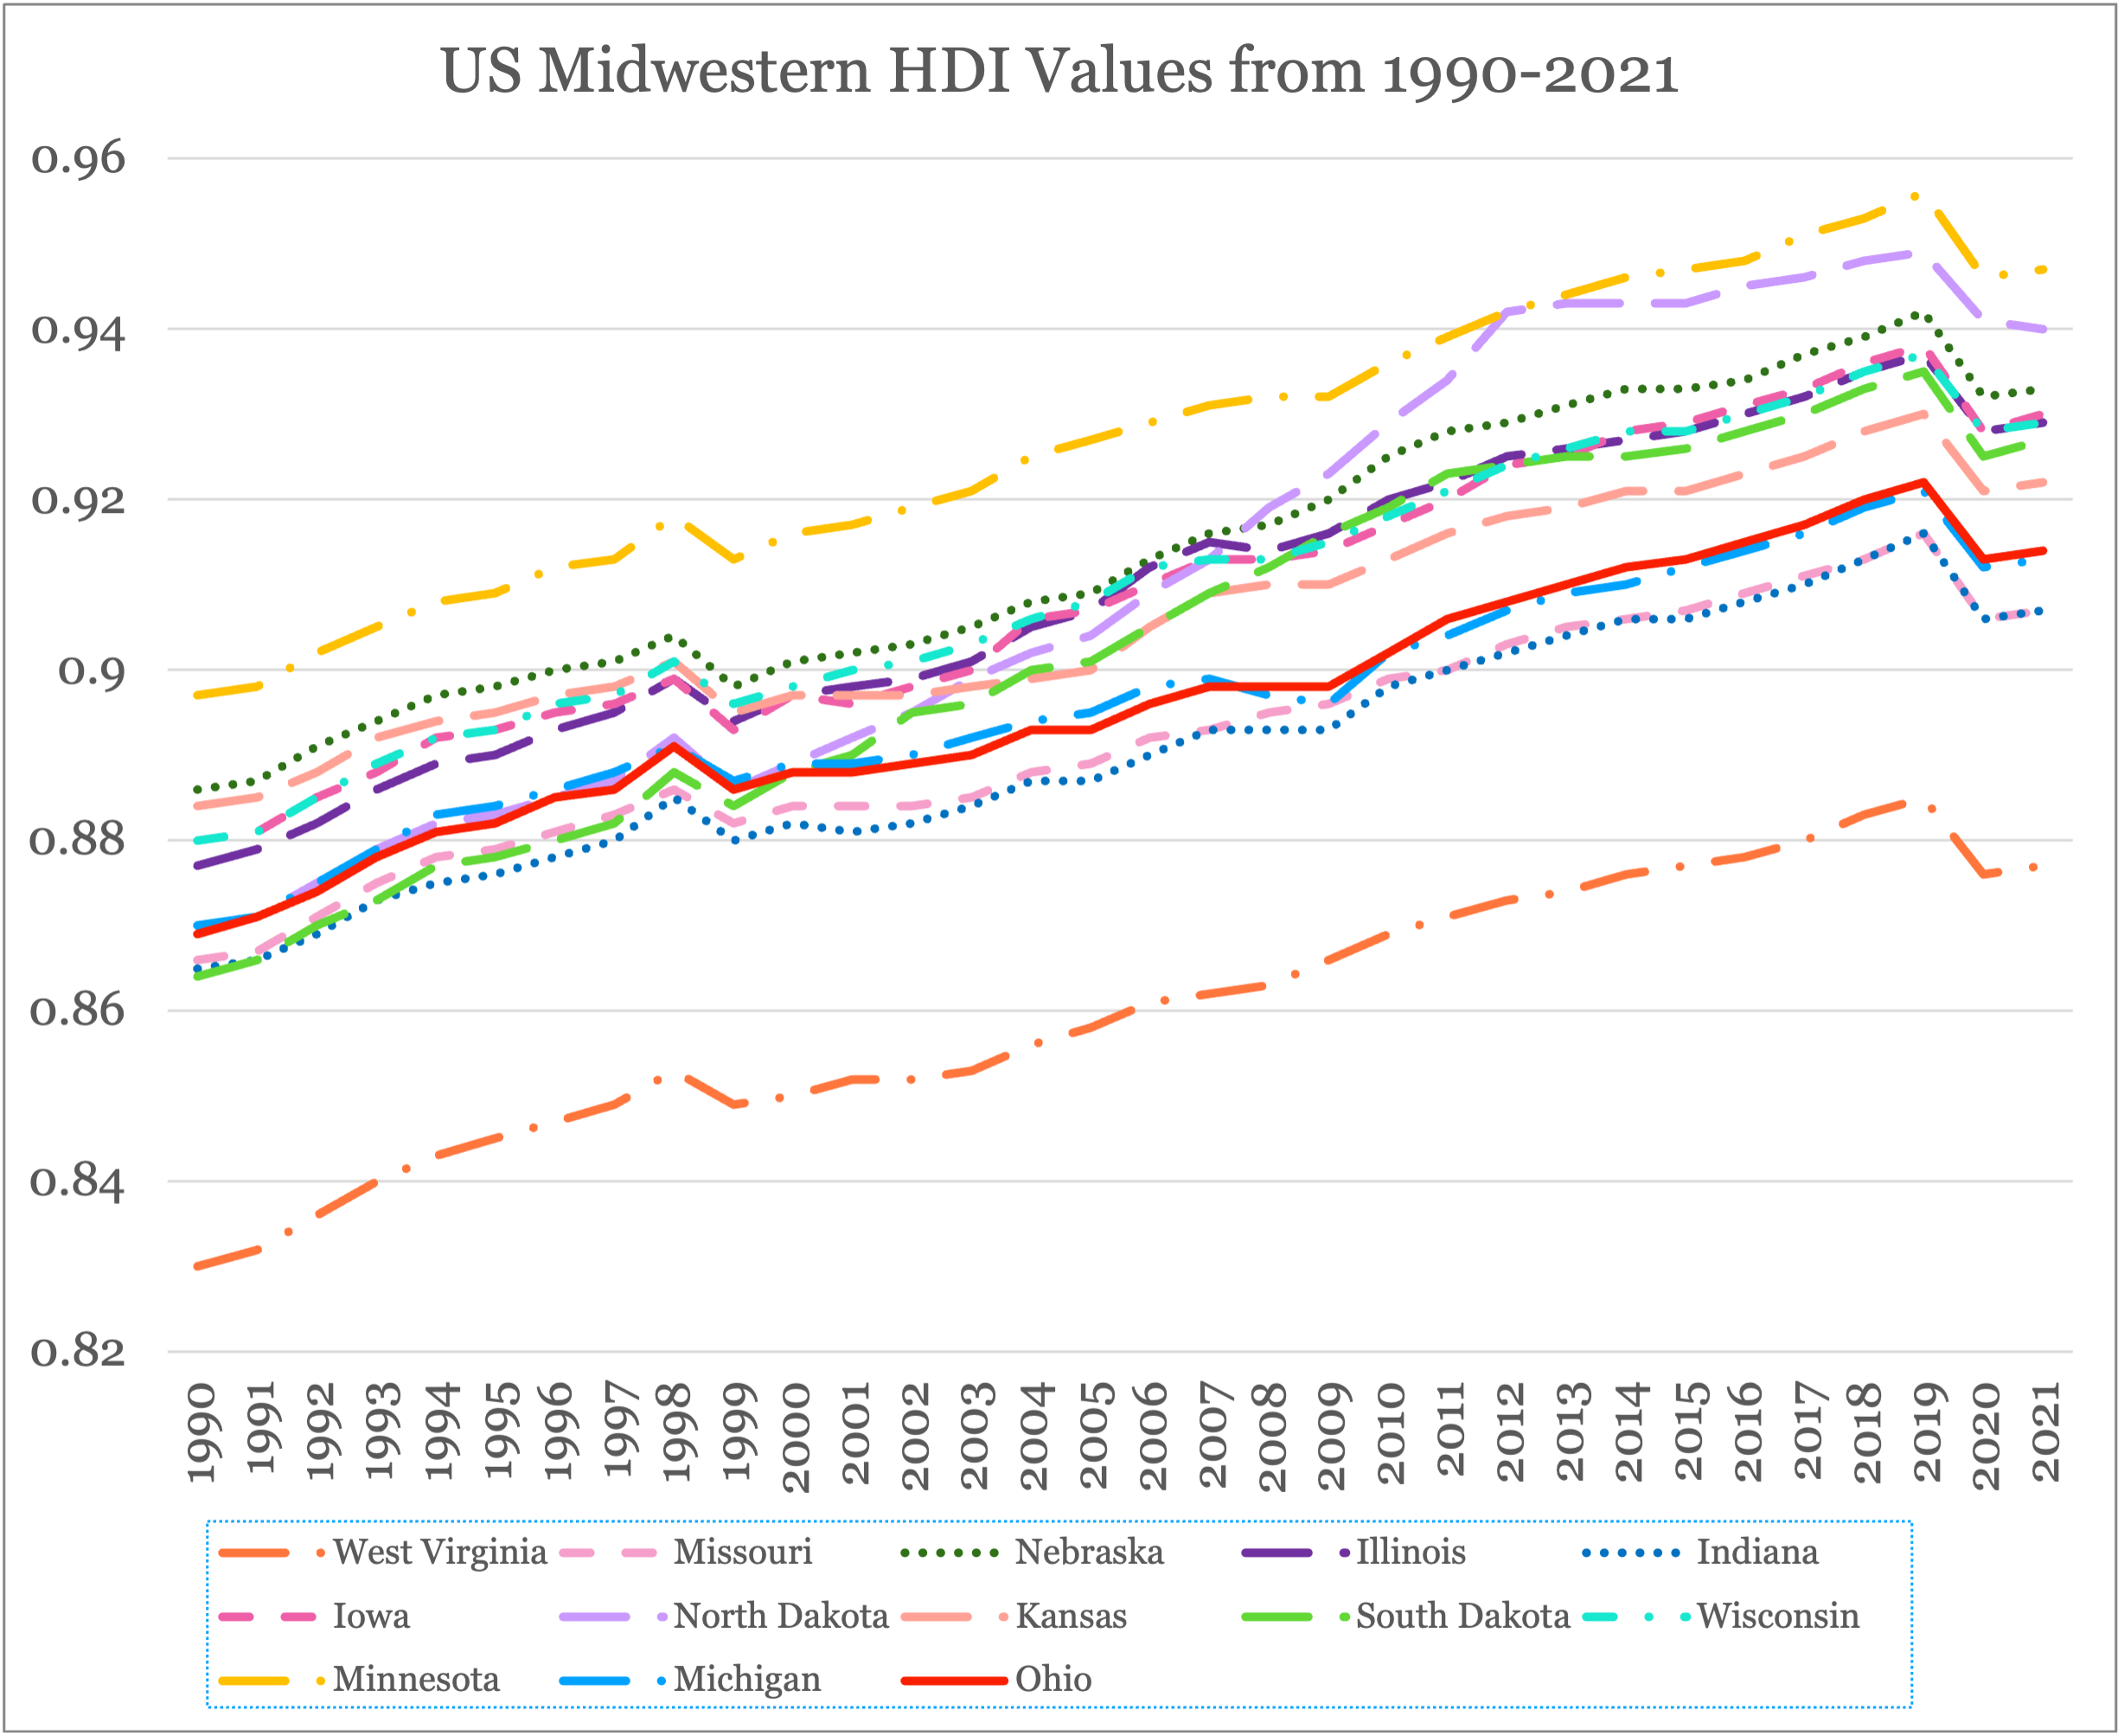
This Fall, Scioto Analysis partnered with a group of students at Ohio State’s Department of Agricultural, Environmental, and Development Economics to conduct a study on human development in Ohio. This study goes beyond dollars and cents and brings health and education indicators to assess the well-being of Ohioans.

For the first time, this study compares human development between racial groups in Ohio and across counties. We found that despite human development scores improving over time, there are disparities between white Ohioans and other groups as well as geographically across the state when it comes to income, health, and education.

Keep your eyes open: our goal is to round out this research in 2024 with a study focusing on a new frontier for well-being analysis in Ohio: subjective well-being.

Poverty in Franklin County, Ohio

Before the pandemic, a group of county leaders in Columbus’s Franklin County, Ohio were spearheading an ambitious project to fight poverty in the county. In 2021, the county hired Cleveland NAACP President Danielle Sydnor to lead the RISE Together Innovation Institute, a permanent center working to fight poverty in the County.

To create a baseline for their work, RISE Together partnered with Scioto Analysis in 2023 to conduct an ambitious study of poverty in the county. This culminated in the 2023 Poverty Snapshot–a study of poverty in Franklin County that covered topics ranging from prevalence, intermittency of poverty, interactions with employment, housing, and public policy, and poverty disparities.

A few of the findings of the report are as follows.

  • One in seven Franklin County residents lives in poverty.

  • Child poverty likely costs Franklin County $5.2 billion in economic activity annually in the form of reduced earnings, crime, health impacts, and child welfare impacts.

  • Black, Hispanic, and Asian residents of Franklin County all experience poverty at higher rates than white residents. Despite this, most people experiencing poverty in Franklin County are white.

  • Hundreds of thousands of Franklin County residents are lifted from poverty by federal programs, with the most significant impacts coming from Social Security, refundable tax credits, and economic stimulus payments.

Scioto Analysis will continue supporting RISE Together in 2024 as they look to use these findings to build the case for policies that reduce poverty throughout the county.

3C+D Economic Impact Study

Columbus has not had intercity passenger rail in half a century. A group of people under the banner of All Aboard Ohio are looking to change that.

In 2023, this group partnered with Scioto Analysis to conduct an economic impact analysis of expanding passenger rail in the state of Ohio. The “3C+D Corridor” would connect Cleveland, Columbus, Dayton, and Cincinnati with passenger rail service.

In our analysis, we found initial investment would generate over $100 million in gross state product and that annual economic impact of the corridor would generate tens of millions of dollars in gross state product.

We also found investment in the 3C+D corridor will create 1,100 to 1,200 jobs, most in the construction industry. Revenue generated from the nine stations due to ridership will support 170 to 320 jobs every year, primarily in the transportation and warehousing industry but also in a range of other industries.

Finally, we found that initial investment will generate $64 million to $66 million in new wages for workers across the country, which will raise $3.5 million to $3.7 million in state and local tax revenue.

More information on the study can be found on the All Aboard Ohio website.

This year, Scioto Analysis celebrated five years and we had our most impactful year yet. I am looking forward to a 2024 where we can make just as much impact in improving policy analysis at the state and local level and changing the way we measure progress and success.

Passenger rail investment will generate millions of dollars and hundreds of new jobs for Ohio

According to an analysis by Scioto Analysis released earlier this month, a new passenger rail service between Ohio’s four largest metro areas will contribute $106 million to $107 million to gross state product. After the initial investment, the corridor will continue to contribute $25 million to $47 million to gross state product per year from the economic impact of ridership.

"Just the investment to get this line started will have as much economic impact as all the passengers and cargo moved by ship, barge, and boat on Ohio's rivers and Lake Erie over an entire year,” says Scioto Analysis Principal Rob Moore.

The study was sponsored by All Aboard Ohio and funded by a grant from the Columbus Foundation.

The study reveals more investment benefits along the 3C&D Corridor.

Investment in the 3C+D corridor will create 1,100 to 1,200 jobs, most in the construction industry. Revenue generated from the nine stations due to ridership will support 170 to 320 jobs every year, primarily in the transportation and warehousing industry but also in a range of other industries.

Initial investment will generate $64 million to $66 million in new wages for workers across the country, which will raise $3.5 million to $3.7 million in state and local tax revenue.

Ongoing ridership will generate $11 million to $21 million in new wages per year, which will lead to $600,000 to $1.2 million in annual tax revenue.

These results have also been localized to the four major Metro areas, and include the communities of Crestline, Delaware, Springfield, and Sharonville. The City of Hamilton is also a possible station stop and would be included in the Cincinnati Metropolitan Statistical Area if it is ultimately chosen.

All Aboard Ohio will be promoting the results of the study in a series of “whistle stop tour” presentations across the state in January. You can find more information about these presentations here.

Five ways Ohio’s economy changed in 2023

As we approach the end of the year, I thought it would be a good idea to look back at some of the data we have and see how Ohio’s economy changed over the past year. Below are five stories that matter about Ohio’s economy in 2023.

Lower inflation might be helping income levels recover 

According to the most recent American Community Survey, real median household income in Ohio went up by about $1,000 between 2021 and 2022, roughly a 2% increase. During this time, we had generational inflation that suppressed real wage growth despite the fact that nominal household income increased by over 8%. 

In recent months, we’ve seen inflation rates start to fall back down to more manageable levels. Looking forward to 2024, hopefully this means that we might see even more real income growth. 

Both unemployment and underemployment fell

Over the course of the last year, unemployment fell from about 4% to 3% and underemployment fell from about 8% to 6% in the state of Ohio. As the economy continues to recover from the COVID-19 pandemic, it is a good sign to see our main employment indicators continue to improve. 

Additionally, seeing underemployment fall at roughly the same rate as unemployment is a good sign that the jobs people are getting are higher quality. There is still a lot of work to be done to fully recover from the pandemic, but these signs are good indicators that employment quality is improving.

CO2 emissions are creeping back up

One trend that came out of the pandemic was a significant short-term decrease in CO2 emissions. Overall, statewide emissions have been decreasing at a pretty steady rate since about 2008. 

Our most recent emissions data shows a slight uptick in the amount of CO2 emissions. It’s too early to tell whether this is an inflection point or just some noise in an otherwise stable downward trend, but it’s an important trend to keep our eyes on in 2024. 

Health insurance coverage is increasing

According to the most recent American Community Survey data, the number of Ohioans that do not have health insurance fell by about 70,000 people from 2021 to 2022. This is extremely important in the wake of the pandemic, where we saw the importance of a strong public health infrastructure.

Our recent report on human development in Ohio found that because of the pandemic, Ohio’s life expectancy declined. Seeing more people have access to health insurance means it will be easier for people to pay for health care. 

Poverty is stagnant

Poverty in Ohio according to the Official Poverty Measure has largely remained the same after a small decrease in 2021. This is despite the fact that unemployment has been decreasing. For a fairly comprehensive look at poverty statistics in Franklin County, Ohio, check out our recently published Poverty Snapshot.

At Scioto Analysis, we are currently working on updating our Ohio Poverty Measure, which we last published in 2021. This will give us a better understanding of how Ohioans are experiencing poverty, taking into account this specific regional context. This measure also includes the impact of public benefits, something the official poverty measure does not capture.

Franklin County Poverty Snaphot: One in Seven Residents in Poverty

Today, RISE Together Innovation Institute CEO Danielle Sydnor announced the release of the first annual Poverty Snapshot report for Franklin County. This report was authored by Scioto Analysis Principal Rob Moore, who also serves as the Policy Analyst in Residence for the RISE Together Innovation Institute.

The Poverty Snapshot is a comprehensive dive into data that reflects how poverty impacts our residents and communities in Franklin County.  

“The Poverty Snapshot helps us see the real impact that poverty has on the residents of this region and to understand the impact we could have on ensuring all residents have the opportunity to thrive," said CEO Danielle Sydnor. "The RISE Together Innovation Institute will use the Poverty Snapshot data to help our partners deliver a more effective system for alleviating poverty in the County, to develop a robust policy agenda to advocate for some of the most critical issues to families in the County, and finally change the narrative of what poverty is and who's in poverty." 

According to the Poverty Snapshot report:

  • One in seven Franklin County residents lives in poverty.

  • Child poverty likely costs Franklin County $5.2 billion in economic activity annually in the form of reduced earnings, crime, health impacts, and child welfare impacts.

  • Black, Hispanic, and Asian residents of Franklin County all experience poverty at higher rates than white residents. Despite this, most people experiencing poverty in Franklin County are white.

  • Hundreds of thousands of Franklin County residents are lifted from poverty by federal programs, with the most significant impacts coming from Social Security, refundable tax credits, and economic stimulus payments.

"At the County, we will utilize this data to help us understand how to close some serious gaps in the fight against poverty and better deliver services to families in need. The work that RISE Together Innovation Institute is doing is personal to me. I believe it's incumbent on all of us to join forces to improve the community through the lives of those we're serving," says Franklin County Commissioner Kevin Boyce. 

The mission of RISE Together Innovation Institute is to harness the collective power of people and systems to disrupt structural racism and issues of poverty to achieve equity for all Franklin County residents. Their work is rooted in the belief that everyone, regardless of race, income, or zip code, should have the resources and opportunities to thrive and prosper. 

Ohio Economists split on impact of low-income tax cuts

In a survey released this morning by Scioto Analysis, economists were split on the question of whether tax cuts for the lowest income bracket in Ohio helped grow the State economy, with three economists agreeing, five disagreeing, and six who were uncertain. 

Jonathan Andreas from Bluffton University who agreed that these tax cuts contributed to growth wrote: “Because most other state taxes are somewhat regressive [with respect to] income, a progressive income tax just makes the overall tax burden fairly flat and there are theoretical reasons why somewhat progressive taxation should be more efficient for economic growth as long as wealthier people actually pay it rather than spending money on tax lawyers to evade it.”

In contrast, Paul Holmes from Ashland University wrote: “Given Ohio's (close to) balanced budget rule, the effect of decreasing taxes shouldn't be considered in isolation from the corresponding decrease in spending. Overall, I'd expect the effect to be minimal. Further, it seems unlikely that a reduction in taxes of a couple of percentage points would induce significant changes in labor supply. So overall I doubt this change had much effect on [gross state product].“

When asked if these tax cuts reduced revenues for the state, there was near consensus with 11 of 14 economists disagreeing. One reason pointed out by survey respondents was that low income people make up a small percentage of the overall state tax revenue. 

The Ohio Economic Experts Panel is a panel of over 40 Ohio Economists from over 30 Ohio higher educational institutions conducted by Scioto Analysis. The goal of the Ohio Economic Experts Panel is to promote better policy outcomes by providing policymakers, policy influencers, and the public with the informed opinions of Ohio’s leading economists. Individual responses to all surveys can be found here

How does Ohio compare to the rest of the Midwest?

Earlier this week, Scioto Analysis released a new report on Human development in Ohio. For this project, we partnered with students from Ohio State University to collect data on income, education, and health across Ohio in order to see how well Ohioans are doing across the state. 

The Human Development Index works by creating indexes for income, education, and health then estimating the average of the three as the final result. 

The closer the Human Development Index value is to one, the closer that state is to the maximum value for that indicator (e.g. the closer Ohio’s median income is to the maximum median income in the US). This suggests high overall levels of income, education, and health. Conversely, the closer it is to zero, the closer it is to the minimum values for income, education, and health.

Human development decreased during the pandemic

From the chart below, we can see that overall, human development has increased in Ohio since 1990. The main exception is a slight drop in 2020, where the indicators for health and income fell noticeably. The result is that human development as a whole was lower during the pandemic.

Much of this fall was driven by a drop in the health indicator. This indicator is based on life expectancy, so it should be unsurprising that it fell during the pandemic. Additionally, we see a slight decrease in the income indicator, likely due to the recession sparked by COVID-19. Again, the pandemic is certainly to blame. 

Looking forward, we can see that the biggest area for improvement in Ohio is in the health indicator. We should expect some catch-up effect as we become further removed from the pandemic, but even then it stands out as an area that policymakers could address. 

We might also expect the pandemic to have a delayed effect on education outcomes. The education component of the human development index is derived from two data points: the average years of schooling for adults and the expected years of schooling for young children. 

We know that the pandemic has resulted in decreased test scores across the country, but it is unclear how that will translate into future pursuit of education. Our recent study on school spending suggests that lower test scores may decrease the number of people who attend college.

Other Midwest states

Another takeaway from the report is that Ohio lags behind many of its neighbors when it comes to the Human Development Index. Currently, only Kansas, Missouri, Indiana, and Michigan rank lower than Ohio within the Midwest region. 

Much of the Midwest has followed the same trend line as Ohio. A steady increase, with dips around 1999, 2008, and most recently 2020. One thing that has remained constant is the gap between states. 

This is somewhat surprising, mostly because of how close these states are to the maximum value already. I initially suspected that because there wasn’t much room for the states at the top to improve, we would see the states near the bottom catch up. I still think there will be diminishing returns at some point (there is a ceiling on the Human Development Index), but it will be interesting to see how close to one these states can get before they start to taper off.

Landmark study evaluates human development in Ohio

This morning, Scioto Analysis released a study on human development within the state of Ohio. Analysts analyzed and created a Human Development Index for both the nation and counties in Ohio and a demographic analysis of Ohio using data from the Global Data Lab, the American Community Survey, and the Bureau of Economic Analysis.

Analysts found that the country as a whole has been trending positively in terms of human development. Each state has improved its human development index score to some degree over the past three decades. Ohio, itself, has improved from an index value of 0.87 to 0.91. However, when looking at the Midwest, Ohio has ranked in the bottom 25% for the past two decades.

Human development is calculated as a function of income, health, and education levels within the state, each given an equal weight. This measure is based on international standards of evaluating human development.

The data showed the negative the COVID-19 pandemic had on human development as every state saw a dip in its human development during 2020. This trend was similarly echoed in the data for Ohio counties. 

Analysts created a 3-year time series of Ohio Counties’ HDI which, similar to the national trend, showed overall improvement over the 3 years. Counties in Southeastern Ohio had the lowest HDI while northwestern counties held some of the highest. Rural counties with low populations tended to have lower HDI scores than their metropolitan and suburban counterparts.

Delaware County, the suburban neighbor of the metropolitan Franklin County,  consistently ranked as the highest county with HDI scores above 0.98. 

Demographic measures of the HDI components also revealed interesting trends. Asian Ohioans had the highest percentage per population of attaining a bachelor’s degree or higher. African Americans living in Ohio consistently earned the lowest average income, nearly $30,000 less than their Asian counterparts who are the highest earners in the state. Hispanics in Ohio lived on average 2 years longer than White Ohioans and 4 years longer than African American Ohioans. 

The report hopes to spur demand for strategic policy change that better addresses both the racial and geographic inequalities in Ohio and is a part of a larger project Scioto Analysis is conducting, looking into the well-being within Ohio.  

New research bodes well for paid parental leave

Last month, my colleague Michael Hartnett and I attended the Association for Public Policy Analysis and Management’s Fall Research Conference in Atlanta, Georgia. He and I have been doing a bit of work with the Rise Together Innovation Institute on paid leave family policies so Michael attended a few sessions on the effects on paid leave programs.

The researchers at this leading public policy research conference focused most squarely on proximate impacts of paid family leave: who takes leave, impacts on the gender wage gap, and impacts on firms.

While these impacts are important, they tell us little about the most promising aspects of paid family leave: the impact on children of having the individualized attention that paid leave facilitates.

Nobel Prize Winner James Heckman argues educational investments in very young children have higher yields than educational investments in older children and much higher yields than investment in adults. If he is right, that means paying parents to stay home with very young children could yield even higher benefits than already very-effective investments like high-quality early education for three- and four-year-olds.

As we puzzled over the lack of research on long-term impacts presented at APPAM, our prayers for evidence were answered. Just last month, researchers from the University of North Carolina at Chapel hill, Washington University at St. Louis, and the Brazilian School of Economics and Finance released a working paper on the intergenerational impacts of paid family leave.

These researchers used 40 years of survey data covering two generations coinciding with changes in paid family leave policies to see how these changes in leave policies impacted children’s outcomes down the road.

One impact these researchers found was on education and wages for children. Children born under policies that protected leave for parents ended up having higher levels of education and wages than children who did not.

The researchers also found an intergenerational mobility impact of paid leave policies. Children of mothers with lower levels of education tended to have more education if their parents lived under a protected leave policy than children with parents who did not.

Researchers also found that parents under protected leave policies tended to spend more time with children and increase spending on child care for children. This suggests that protected leave policies may have led to more parental investment in children, leading to better educational and labor market outcomes for children.

The researchers also found drawbacks to the protected parental leave policies. They found the “motherhood penalty” of lower wages for mothers was exacerbated under these policies. They also found the policy increased the chance of having a first child but decreased chances of having a second child in the family.

Many municipalities in Ohio are moving forward on paid family leave. In 2016, Cleveland suburb Newburgh Heights made national news when it passed a 6-month paid leave policy for employees–reported as the most progressive in the country at the time. Since, Cleveland, Columbus, and other cities across Ohio have passed paid family leave policies for employees. Even the state of Ohio quietly expanded paid family leave in its most recent budget.

Paid family leave seems like a good benefit for new parents, but it is an especially promising intervention for children. Ensuring parents can give individualized attention to children at the most crucial stage of development could have impacts that cascade across the generations.

This commentary first appeared in the Ohio Capital Journal.

Five impacts of increased school spending

Earlier this week, Scioto Analysis released our most recent cost-benefit analysis. This time, we took a look at how increasing or decreasing school spending would impact Ohio’s students. School spending, like many other policy options that invest in young people, often have far-reaching effects. 

Today, I wanted to look over five of the main effects that come with increased school spending. 

Test scores

The most direct effect of increasing school spending is that it improves the academic performance of students in the form of higher standardized test scores. While a test score is not in and of itself a tangible benefit to our society, higher test scores are correlated with other benefits.

Despite the fact that standardized test scores are a blunt way of measuring any individual’s intelligence, we should expect that, all else being equal, raising test scores in the aggregate is a good thing. It is a sign that on average, students are gaining some amount of human capital that will make them better prepared for their adult lives.

Increased graduation and college matriculation

Researchers have found that increasing per-student spending during elementary and high school leads to higher rates of high school graduation and college matriculation. Functionally, this outcome is very similar to increased test scores. 

From a human capital perspective, these effects have a much greater impact on an individual’s future employability. They can also have the impact of signaling human capital to employers in way that test scores would not on their own. Although these effects take a long time to start accruing benefits for society, we certainly expect that these early investments are worth it.

Increased wages

Higher graduation rates and college matriculation should lead to higher wages. This means students who are exposed to increased spending early on are expected to have higher wages as adults. These higher wages can significantly improve the quality of life for the people who earn them.

Additionally, the rest of society also benefits from these people earning more. An increase in wages means more income tax revenue for the government. If allocated efficiently, these new public resources can lead to even larger benefits for society as a whole. 

Lower social costs

Another effect of people earning more is that they will be less reliant on other forms of non-wage income to get by. Researchers have found that people who graduate from high school are less likely to use government assistance programs, meaning resources can be allocated elsewhere to people who need them. 

Additionally, researchers have found that high school graduates are less likely to be incarcerated. This means increasing the rate of high school graduation can lower direct costs in the criminal justice system, and prevent social costs associated with crime.

Intergenerational effects

Although our cost-benefit analysis did not address intergenerational effects, these could have a large impact on society as well. New research now confirms that increasing wages in one generation can significantly affect the lives of the next generation. 

This means that the benefits from a policy like increased school spending can pay dividends for decades beyond those when the initial spending takes place. Investments that have intergenerational effects can be some of the most valuable policy options from a social perspective. They require patience, but their returns are often worth it. 

Increased school spending could pay off for Ohio

Today, Scioto Analysis released a new study measuring the economic impact of changes in K-12 school spending. We found that if Ohio increased its school spending from its current 2023 spending to more closely model Pennsylvania’s level of spending, (about a $2,800 increase per student), the state could see net economic benefits ranging between $23 and $90 billion. A reduction in spending that models the K-12 spending of Indiana (about a $3,500 decrease per student) would create economic losses between $30 and $120 billion. 

The most significant impact of changes in school spending would be its impact on college matriculation. Increasing school spending contributed to an increased number of high school graduates pursuing higher education. From an increase in spending, we project that there would be an estimated additional $18 billion in benefits, and a loss of $23 billion with a decrease in spending. 

If a change in K-12 spending in Ohio was designated in a way that prioritized funding low income schools, the estimated overall benefits from an increase in spending would be $46 billion as opposed to around $40 billion, and the losses from a decrease in spending would be around $46 billion as opposed to $50 billion. 

In addition to college matriculation, other factors that are influenced by changes in K-12 spending are test scores, high school graduation, and social savings from reductions in crime and welfare reliance. 

This year, Ohio is currently ranked 19th in the nation for its per-pupil K-12 spending. However, a new federal budget approved in July for 2024 and 2025 designated a total of $12.97 billion for K-12 spending, an 11.4% increase. 

This study is part of a series of cost-benefit analyses conducted by Scioto Analysis. Previous cost-benefit analyses were conducted on recreational marijuana, daylight saving time, child tax credit, harmful algal blooms, and urban canopy programs. All previous cost-benefit analyses can be found on the Scioto Analysis website.