Quantitative vs qualitative analysis

At Scioto Analysis, our mission is to provide policymakers and policy influencers with evidence-based analysis of pressing public problems. For us, this almost always means analyzing data and finding ways to quantify impacts. 

However, there are still times when data isn’t quantifiable but analysis is still helpful. For example, when we want to draw insights from written comments on a survey. 

In these instances, there are two main options we have as analysts. First, we can try to quantify these abstract data points. The main issue with this is that quantifying inherently means simplifying the data. When done well, key points can be preserved, but some amount of nuance is always lost when quantifying qualitative data. 

The other option we have is to perform qualitative analysis. 

As someone who went to school specifically for statistics, I am much more comfortable with quantitative analysis compared to qualitative analysis. It is possible even to take qualitative data and manipulate it into quantitative data that you can analyze.

That being said, the methods used to encode qualitative data are quite robust and can provide extremely useful information to analysts. 

But, the more policy analysis work I do the more I have come to value the insights that qualitative analysis can provide when conducted well. Additionally, I think the additional cost that often comes with quantitative analysis is not always worth the additional insights it provides. 

For example, we’ve recently been working on a project trying to better understand the impacts that climate change will have on health equity by midcentury. One of the main areas of focus for this project is on climate change related mental health issues. 

Mental health is a notoriously difficult subject to quantify. Because there is such a wide spectrum of outcomes and there is not any tangible way to measure people’s experiences, quantitative analysis of mental health is almost always limited in its ability to give analysts useful information. 

For this project in particular, a quantitative estimate of how climate change would affect mental health was unnecessary. There is a great deal of qualitative evidence from mental health professionals about how climate change affects mental health. 

To gather some expert opinions on the topic, I spoke with a few mental health professionals about the subject. The context they were able to provide helped us convey the main message of the report without needing to get bogged down with math that would ultimately be unhelpful to the project as a whole. 

One final consideration when comparing quantitative and qualitative analysis is who the intended audience of a study is. Quantitative methods can produce extremely robust results for use in tasks like budgeting by professionals who use math from day to day, but it might not be worth doing if you need to explain how you encoded peoples' written comments and performed a proportional odds logistic regression to a group that doesn’t have any background in statistics. 

In this case, it might be more helpful to those people if instead of throwing hard-to-interpret regression results at them, you instead drew some qualitative insights that get the same point across. 

Overall, I generally believe that quantitative analysis provides better insight into many questions than qualitative analysis. However, the more work I do in policy analysis, the more I have come to appreciate what qualitative analysis can provide. Understanding the pros and cons of both methods is important for anyone who wants to improve decision making in the public sector.

How Ohio can reduce poverty

Last month, the Census Bureau released its 2022 report on poverty in America. This report confirmed that poverty numbers increased dramatically in 2022 as the pandemic expansion of the child tax credit lapsed.

With after-tax poverty increasing more in a single year than ever before and child poverty more than doubling in 2022, the outlook on poverty in the United States is bleak. But state lawmakers still have tools at their disposal to fight poverty.

The National Academies of Science, Engineering, and Medicine released a report last month on policies to break the cycle of intergenerational poverty. While this report runs the gamut of different interventions, here I will list five policies specifically tailored toward increasing incomes for people in poverty.

Minimum Wage

Ohio last increased its real minimum wage in 2006 and it has increased every year since in nominal terms due to inflation adjustments built into that change. Minimum wage increases can help people in parts of the state with few options for work who can have their wages artificially depressed by employer market power.

Temporary Assistance for Needy Families (TANF)

TANF is designed to be the low-income cash assistance program for the United States and states have wide latitude for how to spend these funds. Ohio only spends 19% of its TANF budget on basic assistance, which is generally paid out as cash assistance to families in deep poverty. Others are earmarked specifically toward child care, eaten up by administration, or pay for work activities.

Nationally, states spend 23% of their TANF budgets on basic assistance. West Virginia spends 34% of its TANF budget on basic assistance and Kentucky spends 75% of its budget on basic assistance. Spending more of this budget on cash could instantly pull families out of poverty who are experiencing it now.

Earned Income Tax Credit

The Earned Income Tax Credit is a cash program that pulls more people out of poverty than any program nationwide besides social security. Many states, including Ohio, have a state-level earned income tax credit. A 2019 study by my firm Scioto Analysis found refundability reforms could put an extra $150 to $900 per household in the pocket of low-income Ohioans.  By expanding the state credit by changing a refundability loophole that makes most families in poverty ineligible for the program, the state could improve incomes for hundreds of thousands of low-income Ohioans.

Child Tax Credit

The culprit for the increase in poverty rates in 2022 was expiration of pandemic-era expansion of the Child Tax Credit. The Child Tax Credit gives cash to families raising children and has been shown to improve future health and labor market outcomes for those children. Scioto Analysis has estimated that a state child tax credit in Ohio could generate between $60 million and $300 million in net benefits.

Negative Income Tax

If Ohio wanted to swing for the fences on poverty, it could do that with a negative income tax. This is a cash transfer program that could theoretically abolish poverty with the stroke of a pen. Cash transfers funded by income taxes on people earning more are the most straightforward way to tackle poverty. A negative income tax was proposed during the Nixon administration, but never implemented at the federal or state level.

Ohio has options to raise incomes for people in poverty. Poverty is a policy choice and one that is made by policymakers every single day. It has options to make better ones.

This commentary first appeared in the Ohio Capital Journal.

Five policies to break the cycle of intergenerational poverty

Last week, the National Academies of Sciences, Engineering, and Medicine released a groundbreaking report on reducing intergenerational poverty.

This study looked at the subject areas of health, education, safety, income, and housing as determinants of intergenerational poverty. Crucially, the study offers policy interventions that can be used to break the cycle of intergenerational poverty. Here we highlight some of the most promising policies in the study.

Expanding access to Medicaid

Children in poverty start with worse health outcomes than those not in poverty before birth and those disparities only grow as they age. Access to health care is a key strategy to close that gap. Medicaid is the most common form of health insurance among Americans experiencing poverty. 

The report says that Medicaid expansions in pregnancy and childhood leads to not only better health at birth and throughout childhood but even improved labor market outcomes. This means investment in health insurance coverage now can reduce risk of poverty decades into the future.

Increasing K-12 spending in low-income districts

Currently, Scioto Analysis is conducting a cost-benefit analysis of increases in school spending. While our final results are still pending, we are currently certain of one thing: investments in low-income districts will have more benefits than investment in upper-income districts.

Children from low-income households tend to start school behind their peers in achievement and these gaps do not tend to close over time. Investment in low-income districts can help provide resources which could help reduce those gaps and break the cycle of intergenerational poverty.

Increasing mortgage lending

Crime disproportionately affects people with low-incomes. One result I was surprised to find in this study was that communities with more mortgage lending tend to have lower crime rates. This was found in a study of Seattle lending patterns which found that lending impacted violent crime but not vice versa. More investment in a community can lead to reductions in crime prevalence.

This could have long-term impact on poverty as well. Cleveland Fed Economist Dionissi Aliprantis finds black men who witnessed a shooting as a child have 31% lower earnings than those who did not and that it can be attributable to toxic stress. Reducing gun violence can be a tool for reducing intergenerational poverty.

Expanding housing vouchers

High lead levels, homelessness, overcrowding, frequent moves, and high housing costs are all both symptoms of and causes of future poverty. Increasing access to housing through programs like housing vouchers and coupling those resources with counseling and case management can reduce future incidence of housing insecurity and intergenerational poverty.

Expanding the earned income tax credit

Scioto Analysis has done a cost-benefit analysis of the earned income tax credit and recently conducted a cost-benefit analysis of a statewide child tax credit. These credits, targeted toward low-income households, put cash in the pockets of households with children. This leads to better educational and labor market attainment and health for children down the road.

All of these interventions can be conducted at the state level. States have a wide berth on how they can expand or contract access to Medicaid. States control how much funding goes to school districts. States can encourage lending in communities bereft of investment. States can create voucher programs. And states can create their own earned income and child tax credit programs. Now the only question is whether they are willing to make the investments to make intergenerational poverty a thing of the past.

Why sensitivity analysis matters

In policy analysis, the primary goal is often to make a best guess as to what the impacts of a potential proposal are. Because this work is often on a pretty short timeline, the end result is often a single estimate for the effects of some policy, with much of the behind the scenes work failing to make it into the headlines.

In my opinion, the biggest downside of focusing on point estimates as the main result of interest is that they don’t communicate anything about how likely the result actually is. This is a question that can be answered by a well done sensitivity analysis. 

Through sensitivity analysis, we get the opportunity to test the boundaries of our results. This allows us to see what happens in the best and worst case scenarios. 

I would argue that this information is far more important than a point estimate when it comes to making informed policy decisions. Policymakers should be thinking about questions like what the probability is that we see an effect size of at least 10%, or how likely is it that an intervention breaks even.

These questions require a greater deal of probabilistic thinking which can be challenging. Still, these are the insights that can tend to lead to better decision making. A point estimate is a good talking point, but understanding uncertainty is the key to evaluating risk correctly. 

Sensitivity analysis is also an important way to check and make sure results are credible. Point estimates can sometimes be misleading when the variance of an estimate is extremely high. Just because a point estimate is the best guess does not necessarily mean that the actual outcome of a policy intervention is likely to be close to it. 

On the other hand, sensitivity analysis can help make the case for programs that have lower variance as well. Consider an example from Washington State’s Institute for Public Policy involving cognitive behavioral therapy (CBT). 

One program is targeted at youth in state institutions, the other at moderate-to-high risk adults in the criminal justice system. The first program has a net present value of over $16,000 compared to just under $800 for the second. However, the first program is only expected to have positive value 68% of the time compared to 98% for the second. 

Maybe the effect size of the first program is worth the added risk, or perhaps policymakers are more willing to take that risk with children compared to with adults. Either way, by understanding the full range of outcomes policymakers can make smarter decisions about how to allocate limited resources. 

These are just a few reasons why policymakers should care more about sensitivity analysis than point estimates when evaluating the work of analysts. Point estimates are still important, and the fact that they are easier to communicate to the public should not be underestimated. 

Still, in order to make the best possible decisions, policymakers need to understand uncertainty. It will lead to more effective decisions, and better outcomes for society as a whole. 

Exploring the credibility revolution in economics

One of the three main criteria policy analysts use to measure policies is by their effectiveness. In order to do this, we use estimates from academic research to determine the likely effects of a policy change.

When we are looking for estimates to use in our analyses, we often give priority to research that uses sound empirical methods. For instance, we prefer to cite research drawn from randomized control trials or differences in differences approaches to observational studies. This allows us to better estimate whether a policy had an actual effect rather than some other variable that may have caused a change in the population.

These methods broadly represent what is known in economics as the “credibility revolution.”

In short, the credibility revolution refers to the explosion of econometric methods that has happened in recent decades. Gone are the days relying on theoretical models to estimate policy impacts: now we have the tools to understand real data and apply it to problems in economics and public policy. 

However, as beneficial as the credibility revolution has been, some argue that we have gone too far and begun to overemphasize the results of unreplicable experiments. Kevin Lang, an economist from Boston University, argues this point in his new working paper.

The key result Lang reports is that by his estimate, 41% of rejected null hypotheses in the economics literature are false rejections. This means that more than two in five economics studies could be reporting incorrect results.

This is an extremely surprising result. We base our policy analyses on results from journals like those Lang studied. If economists are truly coming to that many incorrect conclusions, our final policy analysis estimates could be way off. 

One of the main drivers of this conclusion is the fact that in economics, there is very little replication of studies. This is because of practical reasons like the difficulty of finding natural experiments on which to test. Additionally, there is often very little incentive for economists to test each other’s work. Replications rarely get published.

So, what can we do about this problem?

This is a moment where the differences between academics and policy analysts are quite clear. For academics, accurately measuring and reporting results is the most important job. It certainly makes sense for academics to require more stringent guidelines for reporting their findings. This will certainly slow these processes down, but the purpose of academia is truth finding.

Policy analysts and policymakers operate on a much shorter timeline. Because policymaking is subject to political pressures, there are always external considerations when policies are being decided beyond what their expected impact will be.

As a result, our goal as policy analysts is not always to find the best answer, but rather to improve the decision making process. This is not to say that policy analysts don’t have any obligation to the truth, far from it. Instead, our job involves making some prediction, then being honest about the strength of that prediction. 

If 41% of rejected null hypotheses in the economic literature are false rejections, that should not exclude those results from being incorporated into a perfectly reasonable policy analysis. We instead should understand that we might have to be more skeptical about our results, and be effective in communicating that skepticism.

The credibility revolution has been an amazing change in the field of economics. The overall quality of the research being done today is still extremely high. Lang’s paper does not decry the entire field of economics, but rather offers a reminder. There is always uncertainty in the work we do, and we need to be aware of and transparent about that uncertainty when communicating the results of our analysis.

Poverty in the States: 2022

Last week, the U.S. Census Bureau released “Poverty in the United States: 2022,” its annual report on the data the bureau collects on income and poverty in the country.

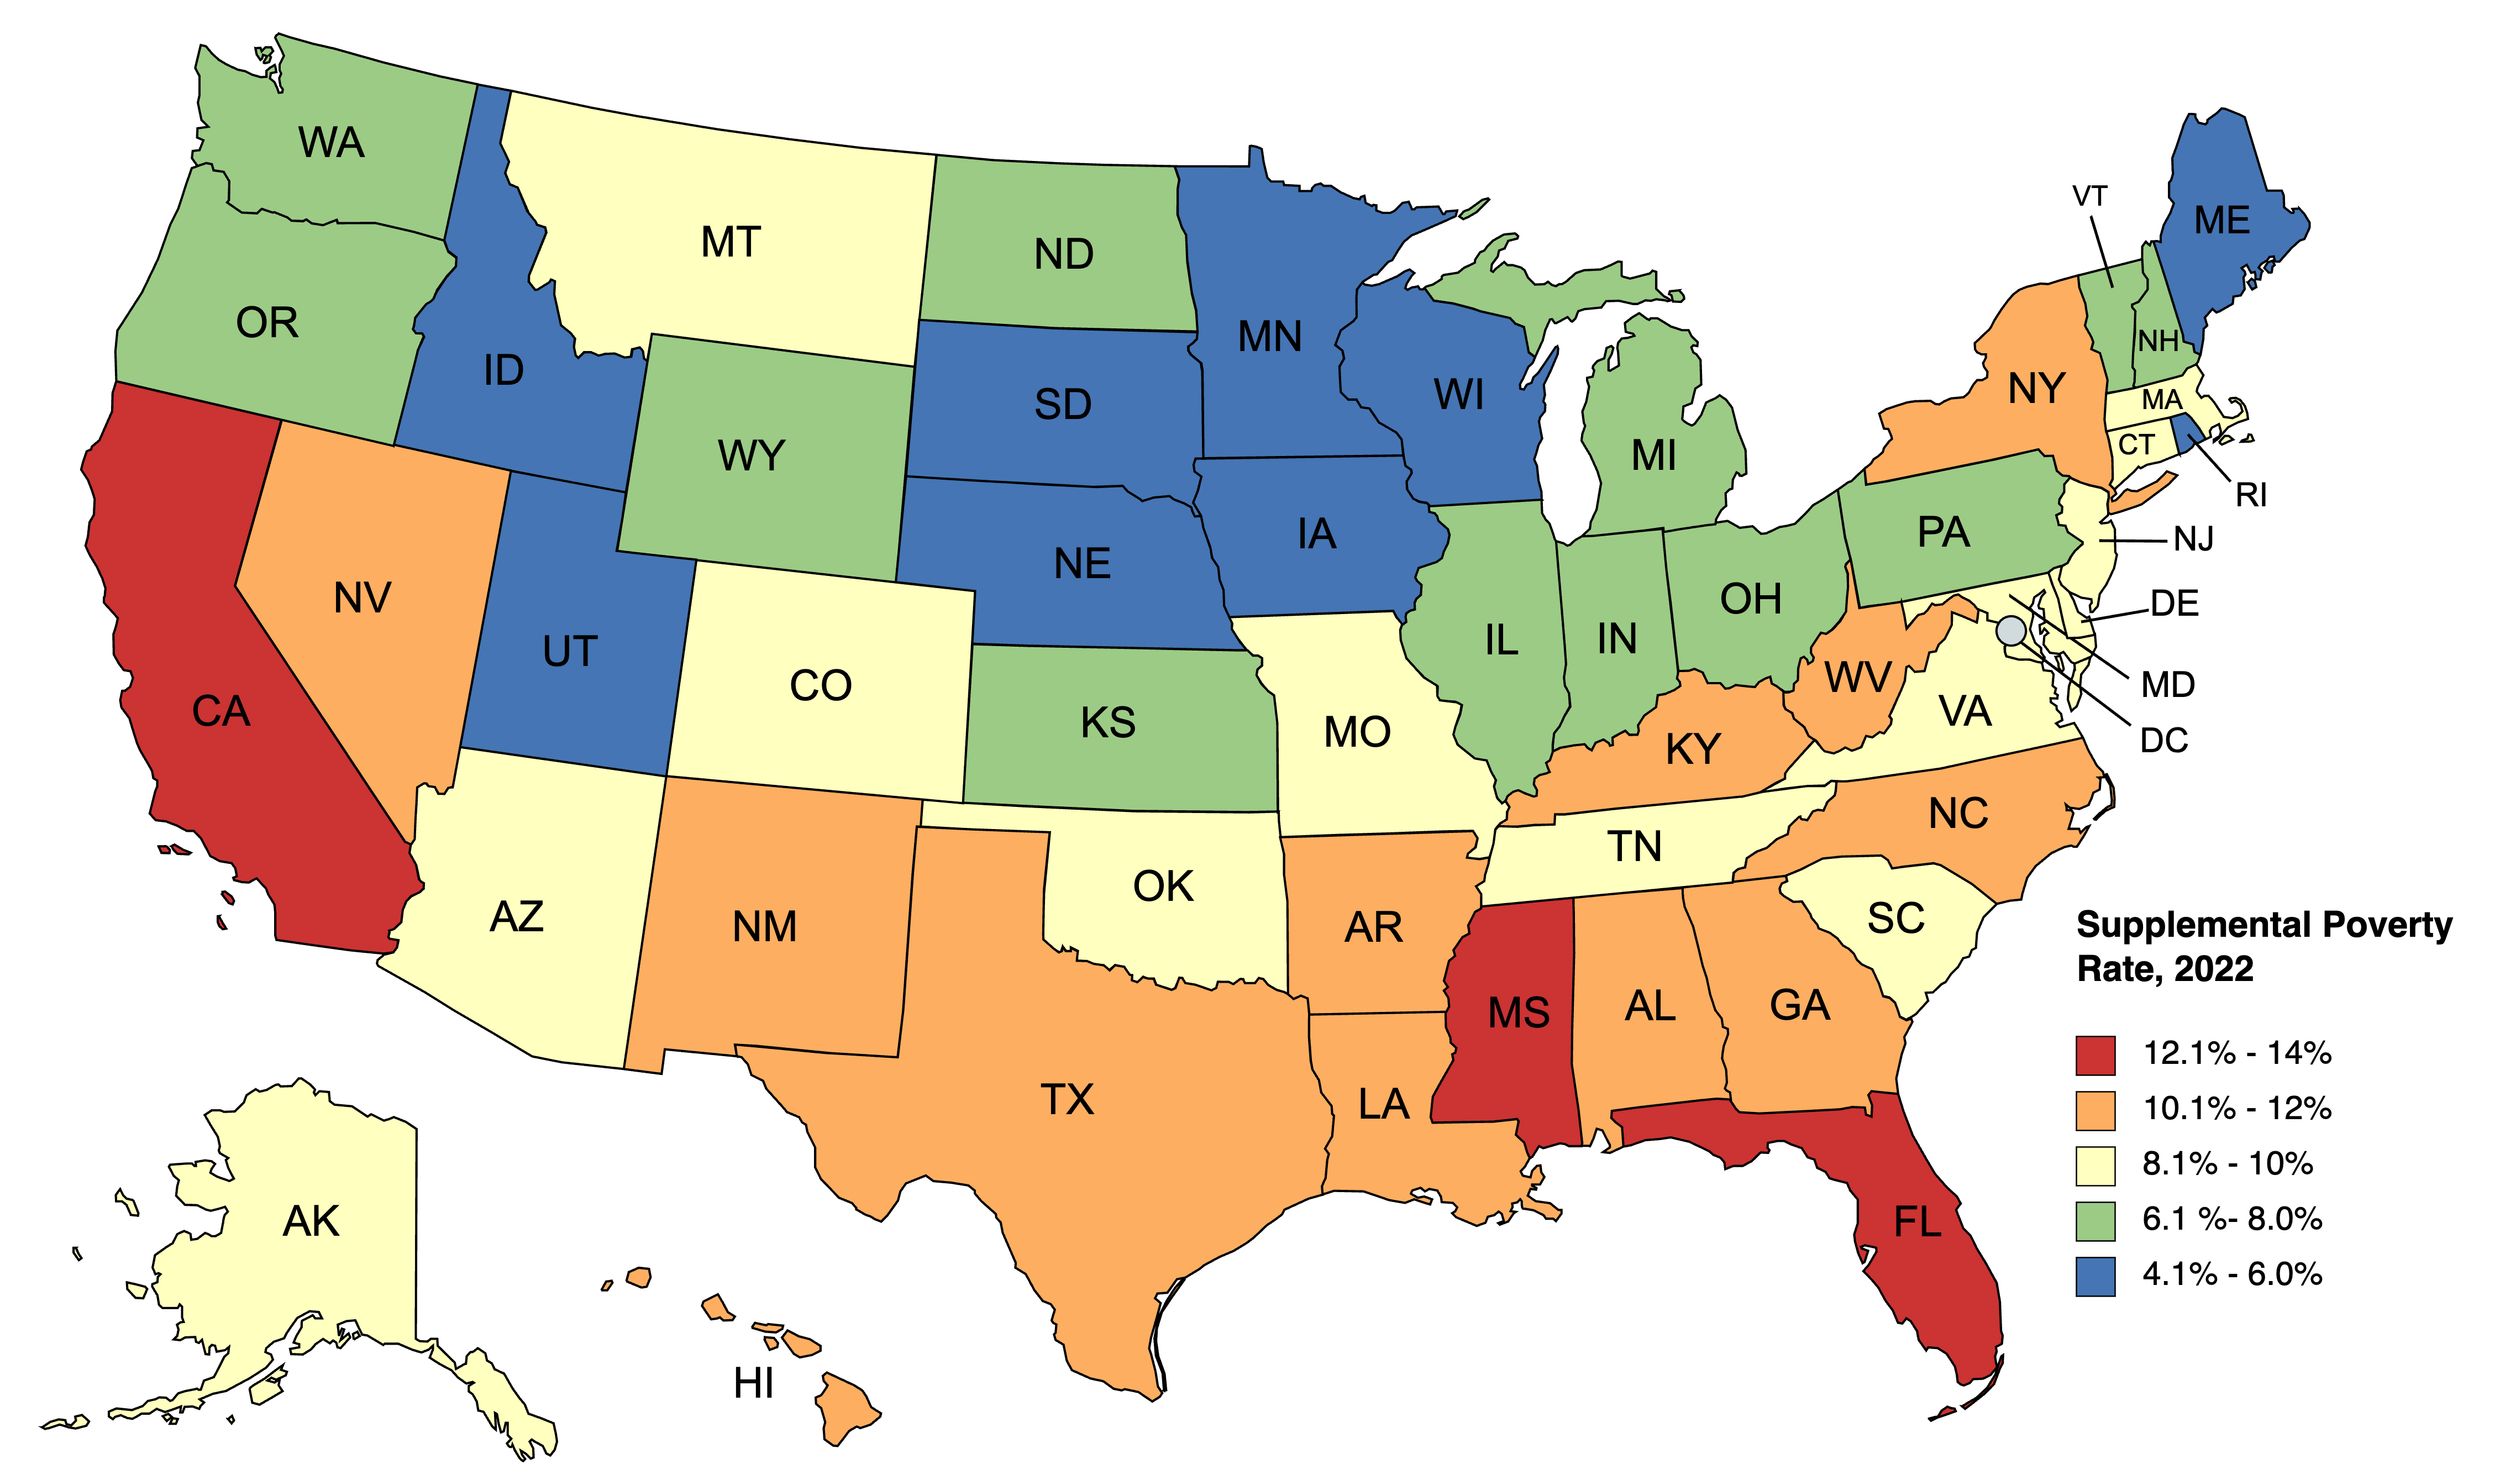
One of the measures the Census Bureau estimates is the Supplemental Poverty Measure. This is a measure of poverty considered by most poverty scholars to be the most useful measure of poverty because it factors in taxes and benefits and makes adjustments for cost of living.

Below is a map of the fifty states color coded to the percentage of the population living in poverty according to the measure. The national poverty rate is 9.8%, so generally you can think of yellow states as close to the national poverty rate, orange and red states as above the national poverty rate, and green and blue states as below the national poverty rate.

Here are some takeaways I have from this data.

Poverty lower in Northern states, higher in Southern states

New York is the only truly Northern state with a poverty rate above 10 percent. Meanwhile, no Southern state has a poverty rate of 8% or lower. The prevalence of poverty between the North and South is stark in the United States.

Poverty is lowest in the Midwest

Likely as a result of the Supplemental Poverty Measure’s adjustment for regional cost of living, the Midwest experiences low poverty rates compared with the rest of the country. Missouri is the only Midwest state that has a poverty rate that exceeds 8 percent. The “Upper Midwest” subregion is home to five of the the U.S.’s nine states with poverty rates below 6 percent

The relationship between poverty and population growth is weak

Among the five fastest-growing states in the country, two (Idaho and Utah) have very low poverty, two (Montana and South Carolina) have middling poverty, and one (Florida) has high poverty. Among the fastest-shrinking states, poverty is more prevalent. Three states (Louisiana, New York, and West Virginia) have high poverty, one (California) has very high poverty, and only one (Illinois) has low poverty, though its poverty rate is still relatively high for the region.

Cost of living is a big factor in poverty

New England is a relatively low-poverty region of the country. The states with poverty above 8 percent in the region, Connecticut and Massachusetts, are both high cost of living states. Similar dynamics in New York and New Jersey drive the states higher despite being high-income states.

This factor also explains why California has the highest poverty rate in the country, the only state topping 13 percent poverty. High cost of living plunges many into poverty who would be able to live more comfortably elsewhere. This may be driving California’s heavy emigration to nearby states with more opportunity.

Data like this gives us an idea of the dynamics of poverty in the United States. We can see the relatively high poverty in subregions like Appalachia and the Deep South and relatively low poverty in the Upper Midwest and Pacific Northwest. It also gives us an idea of how policy is impacting poverty and which states need more work to reduce poverty rates.

Ohio economists think lawsuits against oil and gas companies would have benefits for society

In a survey released this morning by Scioto Analysis, a majority of Ohio economists polled said that cities and the state of Ohio would increase social welfare if they sued oil and gas companies to pay damages for concealing the effects of climate change. 

One economist who agreed was Jonathan Andreas from Bluffton University, who wrote “A lot depends on how we trade off present welfare (which might decrease) versus future welfare (which would hopefully increase).” He goes on to point out that whether or not present welfare decreases depends on how Ohio’s energy market changes. Because Ohio is a net exporter of natural gas but a net importer of other fossil fuels, this effect is somewhat uncertain. 

Additionally, a plurality of economists surveyed agreed that these lawsuits could help reduce inequality, though many respondents were uncertain. 

One economist who was uncertain, Faria Huq from Lake Erie College, wrote “Economically disadvantaged groups tend to be disproportionately affected by the effects of climate change, and suing oil and gas companies would help pay for some of the costs of climate change. However, if the companies passed on some of these costs to consumers in the form of higher prices, in the short run, people with lower incomes may end up having to spend a larger proportion of their incomes on these essential utilities.”

This survey comes days after California became the most recent state to file a lawsuit against oil and gas companies. Previous suits have been filed at all levels of state and local government, such as Multnomah County in Oregon and the city of Honolulu, Hawaii. 

The Ohio Economic Experts Panel is a panel of over 40 Ohio Economists from over 30 Ohio higher educational institutions conducted by Scioto Analysis. The goal of the Ohio Economic Experts Panel is to promote better policy outcomes by providing policymakers, policy influencers, and the public with the informed opinions of Ohio’s leading economists. Individual responses to all surveys can be found here.

Census Bureau releases new poverty numbers

On Tuesday, the U.S. Census Bureau released its annual report on the state of poverty in the United States. Every year, this is the biggest moment in poverty statistics as we get a snapshot of what poverty looked like in the previous year.

While statewide information is forthcoming, with the national numbers we can come away with some important takeaways.

Household incomes are down in 2022

Inflation took a bite out of household incomes as their real value dropped compared to 2021. The silver lining on this measure is that incomes were steady for Asian, Black, and Hispanic households, though they were still substantially lower for Black and Hispanic households than for non-Hispanic whites.

Inequality is down in 2022

For the first time since the Great Recession, the U.S. Gini coefficient, a measure of inequality across the income distribution, decreased in 2022. This could be because inflation pressures hit upper-income households harder than they hit lower-income households.

Poverty before counting benefits is steady

The census bureau estimates 38 million Americans lived in poverty in 2022, 12% of the total population. Neither of these numbers were substantially different from the 2021 numbers.

Black poverty dropped to a historic low

The official poverty rate for Black households dropped from 2021 to 2022. This was its lowest rate on record.

Poverty after counting benefits shot up

2021 was an important year because poverty after counting taxes and public benefits hit a record low. This was due to expansion of the Child Tax Credit and other income supports put in place during the COVID-19 pandemic. 

After Senator Joe Manchin decided he would not support making the child tax credit permanent, the program expired at the end of 2022. This led to the largest single-year increase in poverty after counting benefits, a 4.6 percentage point increase.

Child poverty after counting benefits more than doubled

The decision to end the child tax credit expansion unsurprisingly fell hardest on children. Child poverty after counting taxing benefits lept from 5% in 2021 to 12% in 2022 largely due to expiration of the child tax credit expansion.

So what can we do with this information? Policymakers at the state level have tools to fight poverty.

They can expand the earned income tax credit. The earned income tax credit is the largest anti-poverty program in the country after social security and Ohio has a state-level version of the credit. By expanding the amount of cash this gives to low-income working households, this could take a bite out of state level poverty.

Lawmakers can ensure access to food assistance. The federal government gives states significant leeway to control eligibility for SNAP (formerly “food stamp”) assistance and eligibility for free or reduced breakfast and lunch programs in schools. Both of these are programs paid for by the federal government that keep millions across the country out of poverty. By allowing access to these programs, Ohio can help keep people out of poverty.

If lawmakers really want to tackle poverty, the way to do that would be through basic income. Programs like a negative income tax have been considered in the United States for half a century and were utilized during the pandemic. The most straightforward way to fight poverty is to provide people with income.

Poverty is a policy choice, and one that can be made at the state level. Let us hope that someday policymakers will see it as a priority.

This commentary first appeared in the Ohio Capital Journal.

How can we make taxes more equitable?

Taxes are one of the most important tools policymakers have at their disposal to change the way our society works. They can correct market failures, they are important for financing critical public goods and services, and almost everyone hates them.

There are a lot of opinions out there about exactly how our taxes should be structured, but one thing most people can agree on is that regressive taxes are often undesirable. As a reminder, regressive taxes are those where people with lower income end up paying a greater percentage of their income on the tax. 

The opposite of regressive taxes are progressive taxes, where as income increases people end up paying a higher percentage of their income on the tax. The most well known progressive tax is income tax, where increasing tax rates are specifically part of the structure. 

Progressive taxes are good because they are often one of the most effective tools for reducing inequality. This is because lower-income individuals often receive a bigger portion of the benefits from public goods and services. When a higher percentage of the funds that pay for those programs comes from higher income individuals then inequality should fall. 

One issue with income taxes in particular is that as people get wealthier, they tend to rely less and less on wages as their primary source of income. Instead, the ultra wealthy tend to have a much higher percentage of investment income compared to everyone else. 

Through strategies such as “buy, borrow, die” the ultra wealthy are effectively able to dodge paying capital gains taxes on their investments, allowing them to maintain an extremely high level of consumption without paying nearly as much in taxes as if they were being paid an extremely large salary. 

One solution to this loophole proposed by the Tax Policy Institute is to institute a value added tax (VAT) and use it to finance a universal basic income (UBI) program. Researchers have estimated that such a program would increase the after-tax income of the poorest 20% of households by 17 percent. 

And because a VAT is a tax on consumption, everyone who consumes is liable for taxes relative to how much they consume.

This is a great example of excellent policy analysis practice. There is an identifiable problem (the ultra wealthy are largely able to avoid being taxed despite having high levels of consumption), an interesting solution (VAT), and a quantifiable outcome showing the impacts across the income distribution.

While it’s possible for a state to add a VAT to their tax code, a policy change that significant is much more likely at the federal level. What State and local policymakers should try and take from this study is an understanding of just how valuable progressive taxes can be. 

Assuming those funds are earmarked for programs that have high returns on investment, especially if they benefit lower income households, progressive taxes can do a lot of heavy lifting on reducing inequality.

What’s the matter with zoning?

Conversations in Columbus, Ohio have been brewing for years about an overhaul of the city’s 70-year-old zoning code.

City officials are now saying they will likely vote on a large reform package this spring. While zoning, or restriction of land for particular uses, feels as American as apple pie, the institution is only an invention of the 20th century. The first zoning code was adopted in Los Angeles in 1904 and it was only affirmed as constitutional in a 1926 case involving the village of Euclid, Ohio.

While setting certain land aside for certain uses seems reasonable on its face, researchers have found some negative side effects to strict zoning codes.

Increased cost of housing

The most well-documented effect of strict zoning is the impact it has on the cost of housing. One 2018 study found that the implicit “tax” on housing levied by zoning exceeds the public costs levied by new construction.

This means housing is made more expensive than needed for an efficient housing market due to zoning because it limits the ability for enough housing to be created to meet demand.

Another study looked at the supply of housing in markets in the United States with strict zoning rules, finding supply could not keep up with demand in those markets. Still another study attributes much of the growth in United States housing prices over the past forty years to zoning restrictions.

Homelessness

Strict zoning can also have an impact on the most vulnerable. More land use restriction means less available housing for those who need it. A study earlier this year by a University of Maryland researcher found that cities with more restrictive zoning rules experienced higher rates of homelessness. This is because it reduces the amount of available housing and increases its price, pricing some people out of the market for housing altogether.

Economic and Racial Inequality

Zoning is a powerful tool for shaping the socioeconomic landscape of a city. A growing body of research suggests neighborhoods can have substantial impact on future outcomes for children.

Some have argued that zoning allows people in power to concentrate wealth and lock others out of neighborhoods.

This pattern of policymaking can also lead to instances of de facto racial segregation. Some scholars argue this was part of the historical justification behind zoning in the first place.

Restrictive zoning used side by side with redlining is an effective tool for enforcing de facto racial segregation.

Economic Growth

A clear impact of restricting use of land is that people cannot react to changes in needs quickly. If a neighborhood was once a good candidate for industrial development but now is much more attractive as a residential area, zoning needs to move faster than developers to keep up pace or people will not be able to live in these areas. This means strict zoning laws can put a damper on growing local economies or make it difficult for more sluggish local economies to adapt.

Some cities, like Columbus, are taking the lead on zoning reform. But this reform can also be led at the state level. California, Connecticut, Massachusetts, and Oregon have all passed legislation mandating looser zoning at the local level. Utah had an innovative solution, appropriating funds for local governments to use for local zoning reform.

Zoning reform has the potential to be a place where people can make compromises across the aisle. Reform of zoning appeals to free-market adherents and advocates for racial justice. If we can grow our economy and make it more equitable at the same time, what is there to lose?

This commentary first appeared in the Ohio Capital Journal.